Robust demand sends pump prices higher
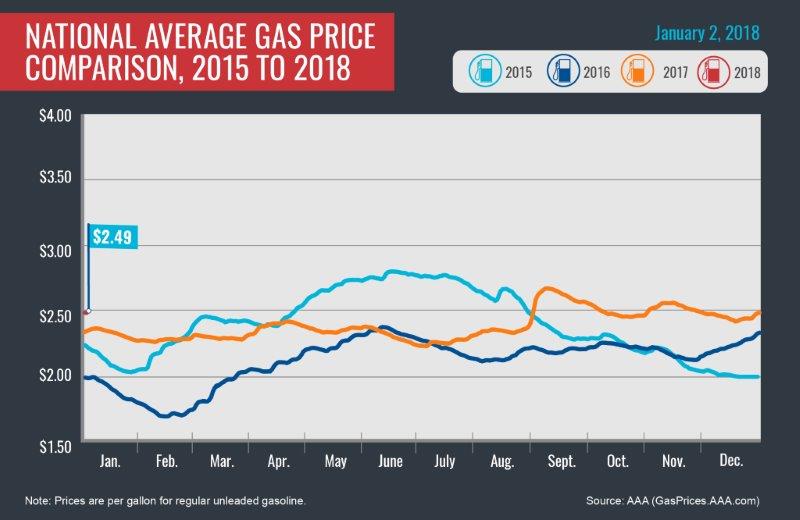
PORTLAND, Ore., – Drivers are paying the highest prices for gasoline at the start of a new year since 2014 when pump prices were more than $3 per gallon. High travel volumes over the holidays put upward pressure on prices. In Oregon, the gas tax went up four cents on Jan. 1 to 34 cents a gallon as part of the $5.3 billion transportation funding package that was approved by Oregon lawmakers during the 2017 legislative session. For the week, the national average for regular unleaded gains four cents to $2.49 a gallon while the Oregon average ticks up half a cent to $2.79.
“The record-breaking travel volume over the holidays sent pump prices climbing as we wrapped up 2017. AAA expects pump prices to trend lower this month as demand drops,” says Marie Dodds, public affairs director for AAA Oregon/Idaho. The latest Energy Information Administration (EIA) report measures gasoline demand at a strong 9.5 million b/d, which is typical of the holiday season. However, historical data shows that in early January demand typically drops and stays below the 9 million mark for the first few months of the year.
Oregon is one of 40 states and the District of Columbia where gas prices are higher week-over-week. The largest increase is in Delaware (-13 cents). The largest weekly decrease is in Alaska (-2 cents).
Oregon is one of 36 states and the District of Columbia where gas prices are lower now than a month ago. The national average is the same and the Oregon average is four cents less than a month ago. The largest monthly decrease is in Alaska (-17 cents). The largest monthly increase is in Indiana (+24 cents).
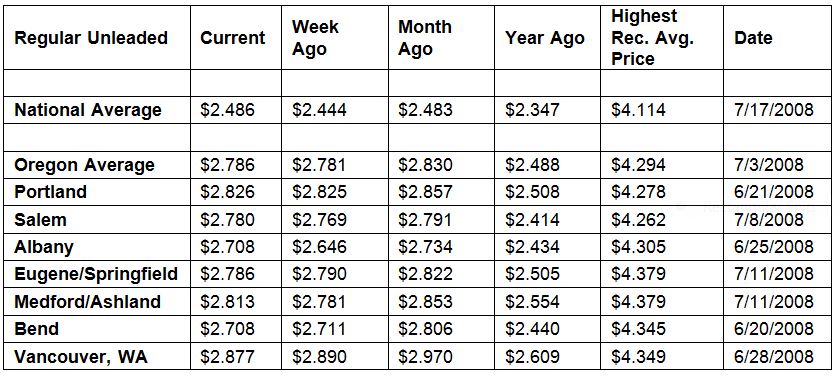
The West Coast still has the most expensive gas prices in the nation with six of the top ten markets in this region. Hawaii has the most expensive gasoline in the country, followed by California and Alaska. These states remain the only three with averages at or above $3 a gallon. Washington is fourth. Oregon is fifth most expensive for the 27th week in a row.
| Rank | Region | Price on 1/2/18 |
| 1 | Hawaii | $3.28 |
| 2 | California | $3.11 |
| 3 | Alaska | $3.08 |
| 4 | Washington | $2.91 |
| 5 | Oregon | $2.79 |
| 6 | Pennsylvania | $2.74 |
| 7 | District of Columbia | $2.71 |
| 8 | Michigan | $2.69 |
| 9 | Nevada | $2.65 |
| 10 | Connecticut | $2.64 |
According to EIA’s latest weekly report, the West Coast’s refinery crude utilization rate hit a new record high at 96.3 percent, which is the highest level since the mid-2010s and well above the 80 percent rate seen at this time last year. In addition, gasoline inventories continue to measure above 30 million bbl. for a third week, positioning the region with a comfortable supply level as 2018 begins.
The nation’s cheapest markets are Missouri ($2.22) and Oklahoma ($2.22). For the 23rd week in a row, no states have an average below $2.
Drivers are paying more than a year ago to fill up. The national average is 14 cents more and the Oregon average is 30 cents more than a year ago. This is the fourth-largest yearly increase in the country. Alaska has the greatest year-over-year increase of 39 cents; Montana is second at 35 cents and California is third at 34 cents.
Oil Market Dynamics
Crude oil prices climbed above $60 per barrel to close out last week, reached their highest price of 2017 on the last trading day of the year. This week, oil prices have the strongest start to a new year since 2014. Moving into 2018, prices are expected to continue rising as OPEC’s production reduction agreement will remain in place for the entire year. In addition, anti-government protests in Iran are also putting upward pressure on oil prices.
2017’s increasing oil prices, especially in the fourth quarter, led to increased investment in production and drilling. This allowed the U.S. to reach its highest crude production level — 9.637 million b/d (October) — since April 1971, officially confirmed by EIA last week. This represents a roughly 10 percent gain from the same month in 2016 and a 167,000 b/d increase from September 2017. For 2018, U.S. crude production is expected to hit 10 million b/d for the first time ever, helping the country to meet domestic demand and expand its export prowess to countries that have growing energy demands around the globe. The total number of active rigs, 747, is 222 more than the total active number of rigs at the beginning of 2017. No active oilrigs were added last week, according to Baker Hughes, Inc.
At the close of Friday’s formal trading session on the NYMEX, West Texas Intermediate increased 58 cents to settle at $60.42 per barrel, the highest price of 2017. Today crude is trading around $60, same as a week ago. Crude prices are up about two percent in the last month and are about $7 more per barrel than a year ago.
Drivers can find current gas prices along their route with the free AAA Mobile app for iPhone, iPad and Android. The app can also be used to map a route, find discounts, book a hotel and access AAA roadside assistance. Learn more at AAA.com/mobile.
Diesel
For the week, the national average jumps four cents to $2.87 a gallon. Oregon’s average adds a penny to $3.01. A year ago the national average for diesel was $2.51 and the Oregon average was $2.63.
Find current fuel prices at GasPrices.AAA.com.
AAA news releases, high resolution images, broadcast-quality video, fact sheets and podcasts are available on the AAA NewsRoom at NewsRoom.AAA.com.