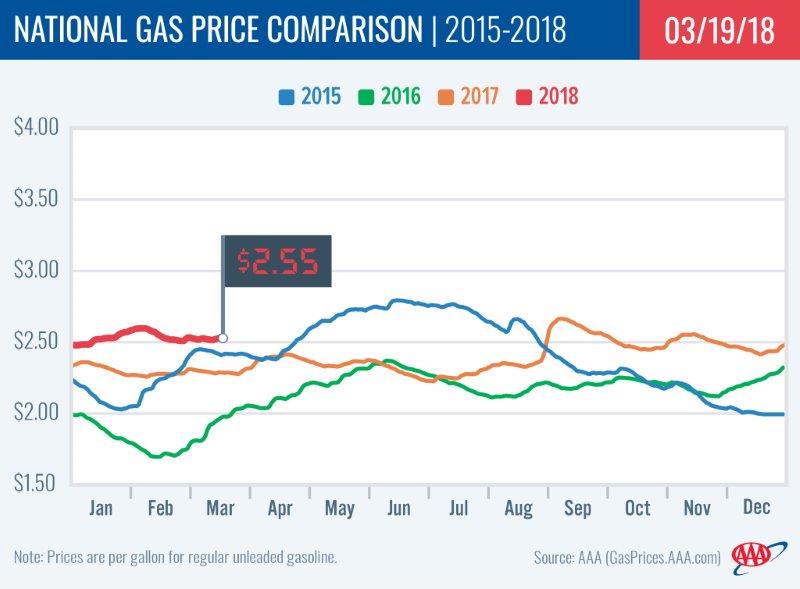
PORTLAND, Ore., – Demand for gasoline in the U.S. is at the highest level on record for March and that’s putting upward pressure on pump prices. For the week, the national average for regular gains four cents to $2.56 a gallon while the Oregon average jumps a nickel to $2.98.
“As demand for gasoline rose, inventories dropped, sending gas prices higher in most states,” says Marie Dodds, public affairs director for AAA Oregon/Idaho. According to the U.S. Energy Information Administration’s (EIA) latest report, demand measured at 9.6 million b/d – levels typical of summer months, not the first quarter of a year. U.S. exports continue to trend high, accounting for a large chunk of this week’s demand data.
AAA continues to predict that gas prices will climb to their spring highs between around April 1 and June 21. Spring prices will be higher than the last couple of years, but likely not as expensive as in 2014 when the national average peaked at $3.70 and the Oregon average peaked at $3.99.
The Oregon average is already just a couple of cents away from the $3 a gallon mark, so it appears certain that the Oregon average will rise above $3 very soon,” adds Dodds. The last time Oregon hit $3 per gallon was May 8 through Aug 16, 2015.
Oregon is one of 40 states and the District of Columbia where gas prices are higher week-over-week. The largest increase is in Illinois (+8 cents). Ten states are reporting small decreases for the week; the largest decrease is in Minnesota (-1 cent).
Oregon is one of 26 states and the District of Columbia where prices are higher now than a month ago. The national average is three cents more and the Oregon average is 11 cents more than a month ago. This is the fourth-largest monthly increase in the country. The largest is in Michigan (+21 cents). The largest monthly decrease is in Pennsylvania (-7 cents).
The West Coast still has the most expensive gas prices in the nation with six of the top ten states in this region. Hawaii tops the list, followed by California, Alaska and Washington. These states are the only four with averages at or above $3 a gallon. Oregon is fifth most expensive for the seventh week in a row. All West Coast states saw pump prices rise this week, except for Hawaii’s average which is flat.
| Rank | Region | Price on 3/20/18 |
| 1 | Hawaii | $3.51 |
| 2 | California | $3.42 |
| 3 | Alaska | $3.08 |
| 4 | Washington | $3.06 |
| 5 | Oregon | $2.98 |
| 6 | Nevada | $2.87 |
| 7 | District of Columbia | $2.76 |
| 8 | Pennsylvania | $2.76 |
| 9 | New York | $2.69 |
| 10 | Connecticut | $2.68 |
According to the EIA’s latest weekly petroleum report, gasoline inventories in the West Coast region saw a 2.1 million bbl draw last week – a major decline ahead of the spring driving season. Total gasoline stocks in the region sit at 32.4 million bbl, which is approximately 3.4 million bbl more than the level at this time last year.
The nation’s cheapest markets are Missouri ($2.27) and Mississippi ($2.29). For the 33rd week in a row, no states have an average below $2.
Drivers in 49 states and the District of Columbia are paying are paying more than a year ago to fill up. The national average is 27 cents more and the Oregon average is 29 cents more than a year ago. This is the 12th-largest yearly increase in the country. Hawaii has the greatest year-over-year increase of 43 cents; California is second at 43 cents. The only state to see its average price decrease compared to one year ago is Utah (-1.6 cents).
Oil Market Dynamics
Crude oil prices rallied last week after the International Energy Agency’s (IEA) latest monthly oil market report showed that global crude demand is expected to increase to 99.3 million b/d, an increase of 1.5 million b/d over 2017’s rate of 97.8 million b/d. The report also noted that global supply reached 97.9 million b/d last month, which was fueled by growth in domestic production in the U.S. The figure is 700,000 b/d higher than last year’s rate at this time. These findings gave the market some hope that although crude production is booming in the U.S., the newly produced oil will help meet global demand instead of helping global inventories grow.
The latest weekly U.S. crude production rate record – 10.4 million b/d – was set last week, according to EIA. That rate is likely to continue growing, supported by growth in the number of active oil rigs in the country. Last week, Baker Hughes reported an increase of four rigs. The total is now 800, which is 169 more than last year at this time.
At the close of Friday’s formal trading session on the NYMEX, WTI increased $1.15 to settle at $62.34. At the close of Monday’s formal trading session on the NYMEX, WTI lost $0.28 to settle at $62.06. Today crude is trading around $63, compared to $61 a week ago. Crude prices are up about three percent in the last month and are about $13 more per barrel than a year ago.
Drivers can find current gas prices along their route with the free AAA Mobile app for iPhone, iPad and Android. The app can also be used to map a route, find discounts, book a hotel and access AAA roadside assistance. Learn more at AAA.com/mobile.
Diesel
For the week, the national average remains at $2.93 a gallon. Oregon’s average adds a penny to $3.08. A year ago the national average for diesel was $2.51 and the Oregon average was $2.68.
Find current fuel prices at GasPrices.AAA.com.
AAA news releases, high resolution images, broadcast-quality video, fact sheets and podcasts are available on the AAA NewsRoom at NewsRoom.AAA.com.