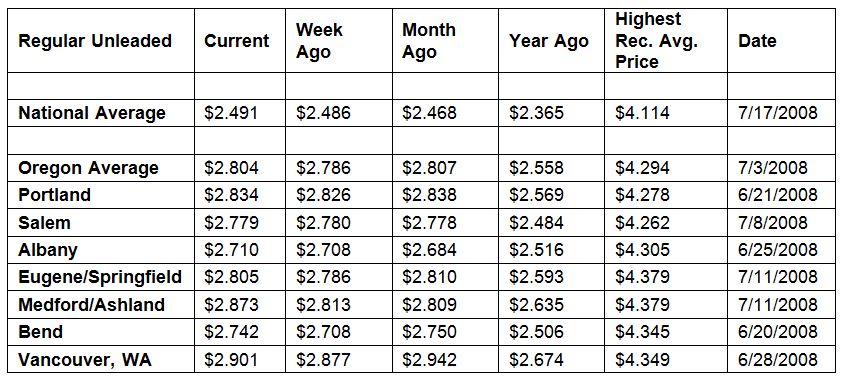
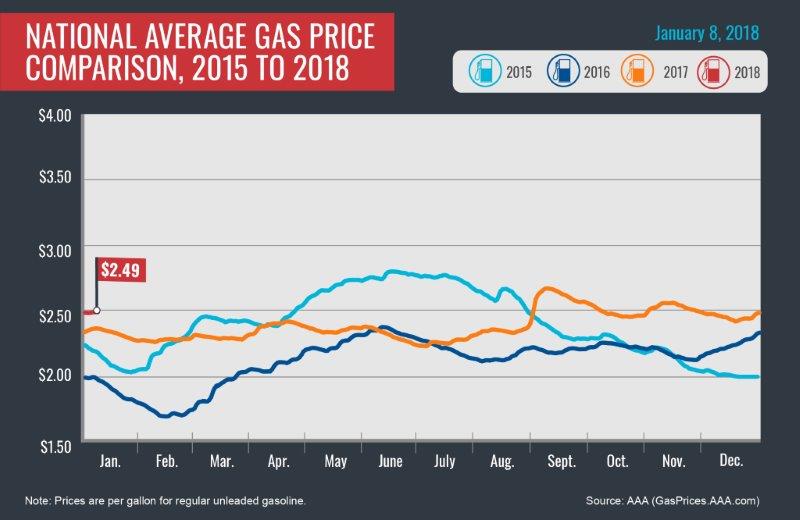
PORTLAND, Ore., – Climbing crude oil prices are pushing retail gas prices higher. Drivers are paying the most for gas in early January since 2014 when the national and Oregon averages were both above $3 a gallon. For the week, the national average for regular unleaded adds half a cent to $2.49 a gallon while the Oregon average ticks up one-and-a-half cents to $2.80.
“Crude oil is holding above $60 a barrel, due to OPEC’s production reduction agreement which will remain in place for the entire year, as well as the unrest in Iran. Higher oil prices are putting upward pressure on pump prices. AAA expects oil prices to drop back into the $50 range later this year, possibly sometime this spring. For now, lower consumer demand for gasoline should help keep a lid on dramatic gas price hikes, unless protests escalate in Iran or there’s some other unforeseen event,” says Marie Dodds, public affairs director for AAA Oregon/Idaho.
Oregon is one of 41 states where gas prices are higher week-over-week. The largest increase is in California (+6 cents). The largest weekly decrease is in Indiana (-10 cents).
Oregon is one of 20 states and the District of Columbia where gas prices are lower now than a month ago. The national average is two cents less and the Oregon average is half a cent than a month ago. The largest monthly decrease is in Alaska (-12 cents). The largest monthly increase is in Delaware (+10 cents).
The West Coast still has the most expensive gas prices in the nation with six of the top ten markets in this region. Hawaii has the most expensive gasoline in the country, followed by California and Alaska. These states remain the only three with averages at or above $3 a gallon. Washington is fourth. Oregon is fifth most expensive for the 28th week in a row.
| Rank | Region | Price on 1/9/18 | |
| 1 | Hawaii | $3.30 | |
| 2 | California | $3.17 | |
| 3 | Alaska | $3.10 | |
| 4 | Washington | $2.92 | |
| 5 | Oregon | $2.80 | |
| 6 | Pennsylvania | $2.76 | |
| 7 | District of Columbia | $2.70 | |
| 8 | Nevada | $2.67 | |
| 9 | New York | $2.67 | |
| 10 | Connecticut | $2.66 |
The Energy Information Administration’s (EIA) latest petroleum status report (for the week ending on December 29) found that gasoline inventories on the West Coast measure near a two-year high at 32.9 million bbl. Healthy refining output rates and increased gasoline imports are contributing to the high inventory volume, which has helped to keep prices in the region mostly stable on the week.
The nation’s cheapest markets are Missouri ($2.23) and South Carolina ($2.25). For the 24th week in a row, no states have an average below $2.
Drivers are paying more than a year ago to fill up. The national average is 13 cents more and the Oregon average is 25 cents more than a year ago. This is the fifth-largest yearly increase in the country. California has the greatest year-over-year increase of 36 cents; Alaska is second at 33 cents; Montana is third at 31 cents and Hawaii is fourth at 26 cents.
Oil Market Dynamics
Crude oil prices started the year above $60 per barrel and that’s where they remain. End-of-year gains were significant according to the EIA. Among the 2017 U.S. crude highlights are:
- Crude oil prices at the end of the year were the highest year-end prices since 2013;
- U.S. crude production increased by more than 384,000 b/d to 9.2 million b/d (based on confirmed data through September 2017); and
- Crude oil exports averaged 1 million b/d through October 2017 – a record high and increase of 445,000 b/d from the 2016 average.
These facts have given the market greater optimism about the potential of prices continuing to climb in 2018, as OPEC’s agreement to reduce production will remain in effect through the end of this year and will help to restrain growing inventories. However, growing U.S. production amid higher global demand growth has given some pause to these optimistic market observations. U.S. production rates in coming months will give a clearer picture. The latest weekly active rig count report from Baker Hughes, Inc. found the U.S. dropped by five rigs to land at 742.
At the close of Friday’s formal trading session on the NYMEX, West Texas Intermediate decreased 57 cents to settle at $61.44. At the close of Monday’s formal trading session, WTI gained 29 cents to close at $61.73. Today crude is trading around $63, compared to $60 a week ago. Crude prices are up about nine percent in the last month and are about $8 more per barrel than a year ago.
Drivers can find current gas prices along their route with the free AAA Mobile app for iPhone, iPad and Android. The app can also be used to map a route, find discounts, book a hotel and access AAA roadside assistance. Learn more at AAA.com/mobile.
Diesel
For the week, the national average jumps four cents to $2.91 a gallon. Oregon’s average adds three cents to $3.04. A year ago the national average for diesel was $2.53 and the Oregon average was $2.68.
Find current fuel prices at GasPrices.AAA.com.
AAA news releases, high resolution images, broadcast-quality video, fact sheets and podcasts are available on the AAA NewsRoom at NewsRoom.AAA.com.


