Pipeline maintenance causes prices to soar in the Pacific Northwest
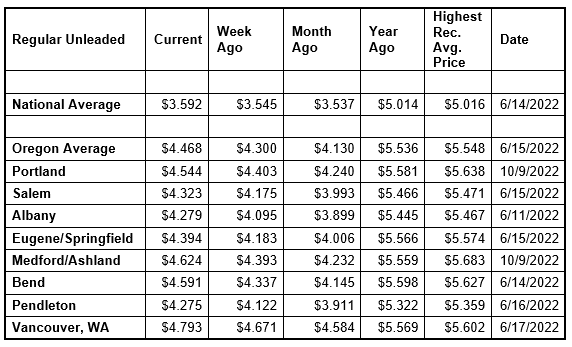
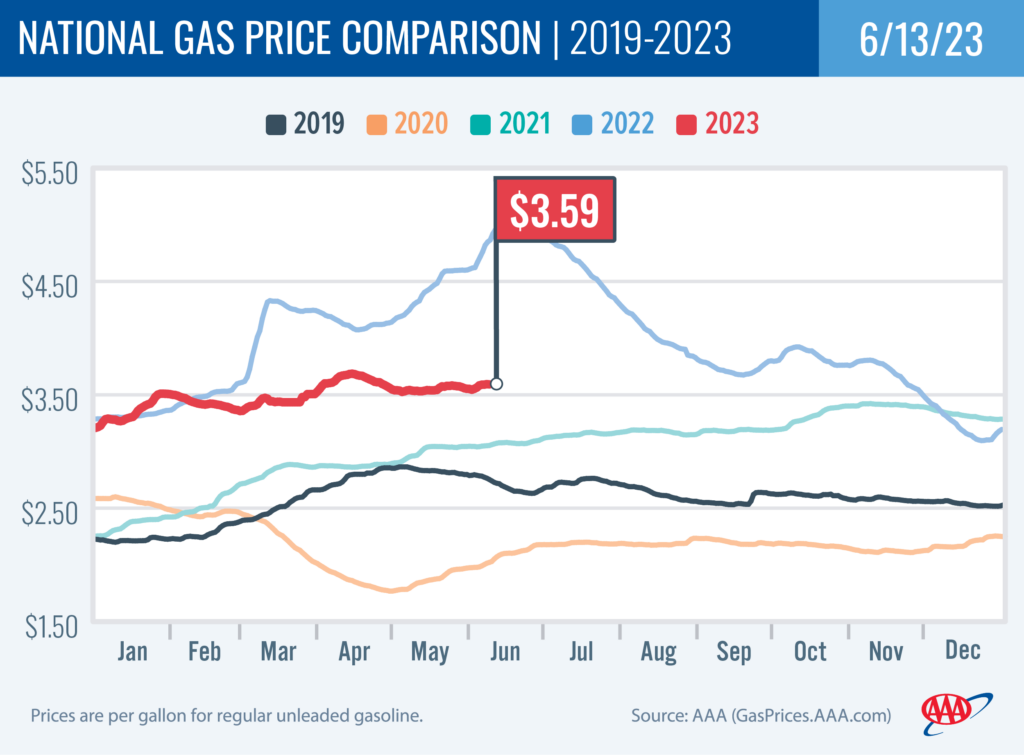
PORTLAND, Ore., – Robust demand for gas is sending pump prices higher in many states, and expected work on the Olympic pipeline is causing some hefty increases in Oregon, Washington, and some other West Coast states. For the week, the national average for regular rises a nickel to $3.59 a gallon. The Oregon average jumps 17 cents to $4.47.
Scheduled work on BP’s Olympic pipeline is expected to start in the next week. This has put upward pressure on wholesale prices in the Pacific Northwest, with the increases being passed on to consumers. The Olympic pipeline runs along a 299-mile route from Blaine, Washington to Portland, Oregon, and transports gas, diesel and jet fuel from four Puget Sound refineries.
“The expected work on the pipeline combined with robust demand for gas are making prices jump here in the Pacific Northwest. With demand for gas in the U.S. remaining above nine million barrels a day for the third consecutive week, it appears that our seasonal surge in driving is getting underway before the official start of summer on June 21,” says Marie Dodds, public affairs director for AAA Oregon/Idaho. “At the same time, crude oil prices in the upper $60s and low $70s are helping to temper pump price hikes in many areas.”
Crude oil prices remain below $75 per barrel, despite the announcement from the Organization of the Petroleum Exporting Countries and other major oil producers, including Russia, known collectively as OPEC+, that it would extend production cuts of more than 1 million b/d through 2024. OPEC+ first announced the production cuts at its April meeting and said the cuts would be in effect through 2023. OPEC+ pumps about 40% of the world’s crude oil.
Crude oil is trading around $69 today compared to $72 a week ago and $121 a year ago. In May, West Texas Intermediate ranged between about $63 and $77 per barrel. In April, WTI ranged between about $73 and $83. In March, WTI ranged between about $64 and $81 per barrel. In February, WTI ranged between about $73 and $80 per barrel. In January, WTI ranged between about $73 and $82 bbl. Crude reached recent highs of $123.70 on March 8, 2022, shortly after the Russian invasion of Ukraine, and $122.11 per barrel on June 8, 2022. The all-time high for WTI crude oil is $147.27 in July 2008.
Crude oil is the main ingredient in gasoline and diesel, so pump prices are impacted by crude prices on the global markets. On average, about 56% of what we pay for in a gallon of gasoline is for the price of crude oil, 20% is refining, 11% distribution and marketing, and 14% are taxes, according to the U.S. Energy Information Administration.
Demand for gasoline in the U.S. demand increased slightly from 9.1 to 9.22 million b/d for the week ending June 2. This compares to 9.2 million b/d a year ago. Meanwhile, total domestic gasoline stocks rose by 2.7 million bbl to 218.8 million bbl. Although gas demand increased, increasing stocks and fluctuating oil prices have contributed to limiting increases.
Quick stats
Oregon is one of 35 states and the District of Columbia with higher prices now than a week ago. Ohio (+23 cents) has the largest weekly jump. Arizona (- 4 cents) has the largest weekly decrease.
California ($4.90) has the most expensive gas in the nation for the 15th week in a row. Washington ($4.83) is second, Hawaii ($4.74) is third, Oregon ($4.47) is fourth, Nevada ($4.29) is fifth, Arizona ($4.26) is sixth, Utah ($4.14) is seventh, and Alaska ($4.04) is eighth. These are the eight states with averages at or above $4 a gallon. This week 41 states and the District of Columbia have averages in the $3-range. One state, Mississippi ($2.99) has an average in the $2 range this week, same as a week ago.
The cheapest gas in the nation is in Mississippi ($2.99) and Louisiana ($3.12). For the 126th week in a row, no state has an average below $2 a gallon.
The difference between the most expensive and least expensive states is $1.90 this week, same as a week ago.
Oregon is one of 42 states and the District of Columbia with higher prices now than a month ago. The national average is six cents more and the Oregon average is 34 cents more than a month ago. This is the largest monthly increase in the nation. Arizona (-41 cents) has the largest monthly drop.
All 50 states and the District of Columbia have lower prices now than a year ago. The national average is $1.42 less and the Oregon average is $1.07 less than a year ago. Indiana (-$1.60) has the largest yearly drop. Washington (-71 cents) has the smallest. A year ago, pump prices were rising rapidly after the Russian invasion of Ukraine.
West Coast
The West Coast region continues to have the most expensive pump prices in the nation with all seven states in the top 10. It’s typical for the West Coast to have six or seven states in the top 10 as this region tends to consistently have fairly tight supplies, consuming about as much gasoline as is produced. In addition, this region is located relatively far from parts of the country where oil drilling, production and refining occurs, so transportation costs are higher. And environmental programs in this region add to the cost of production, storage and distribution.
| Rank | Region | Price on 6/13/23 |
| 1 | California | $4.90 |
| 2 | Washington | $4.83 |
| 3 | Hawaii | $4.74 |
| 4 | Oregon | $4.47 |
| 5 | Nevada | $4.29 |
| 6 | Arizona | $4.26 |
| 7 | Utah | $4.14 |
| 8 | Alaska | $4.04 |
| 9 | Illinois | $4.00 |
| 10 | Idaho | $3.98 |
As mentioned above, California has the most expensive gas in the nation for the 15th week in a row. Washington, Hawaii, Oregon, Nevada, and Arizona round out the top six. Alaska is eighth. Oregon rises to fourth after one week at fifth.
States in the West Coast region are seeing small to large changes on the week: Oregon (+17 cents), Arizona (-14 cents), Washington (+11 cents), Alaska (+8 cents), California (+4 cents), Nevada (+4 cents), and Hawaii (-6/10th of a cent).
The refinery utilization rate on the West Coast rose from 90.7% to 93.1% for the week ending June 2. This rate has ranged between about 73% to 93% in the last year. The latest national refinery utilization rate is 95.8%.
According to EIA’s latest weekly report, total gas stocks in the region increased from 28.33 million bbl.to 29.65 million bbl.
A higher refinery utilization rate and an increase in gasoline stocks can put downward pressure on pump prices. However, expected work on the BP pipeline has pushed prices higher in Oregon and Washington.
Oil market dynamics
Oil markets remain volatile. Crude prices closed below $70 on Monday. The Federal Reserve meets on Wednesday and markets are jittery about another potential hike in interest rates. Last week, crude oil prices rose amid market optimism that summer demand may be more robust than expected, pushing prices higher than expected. Price increases have been capped this week despite the announcement from the Organization of the Petroleum Exporting Countries (OPEC) and its allies, including Russia, known as OPEC+, that member nations would continue to keep their production reduction agreement from May 2023 in place through 2024, and Saudi Arabia approved an additional cut of 1 million b/d starting in July 2023. Additionally, the EIA reported that total domestic commercial crude inventories decreased by 500,000 bbl to 459.2 million bbl last week.
At the close of Friday’s formal trading session, WTI fell $1.12 to settle at $70.17. At the close of Monday’s formal trading session, WTI fell $3.05 to close at $67.12. Today crude is trading around $69, compared to $72 a week ago. Crude prices are about $54 less than a year ago.
Drivers can find current gas prices along their route with the free AAA Mobile app for iPhone, iPad and Android. The app can also be used to map a route, find discounts, book a hotel and access AAA roadside assistance. Learn more at AAA.com/mobile.
Diesel
For the week, the national average slips a penny to $3.91 a gallon. The record high is $5.816 set on June 19, 2022. The Oregon average dips a penny to $4.41. The record high is $6.47 set on July 3, 2022. A year ago the national average for diesel was $5.77 and the Oregon average was $6.15.
Find current fuel prices at GasPrices.AAA.com.
AAA news releases, high resolution images, broadcast-quality video, fact sheets and podcasts are available on the AAA NewsRoom at NewsRoom.AAA.com.
Find local news releases at https://oregon.aaa.com/community/media/media-contacts.html
Fuel prices are updated daily at AAA’s Daily Fuel Gauge at AAA Gas Prices. For more info go www.AAA.com. AAA Oregon/Idaho provides more than 880,000 members with travel, insurance, financial and automotive-related services, and is an affiliate of AAA National, serving more than 63 million motorists in North America.