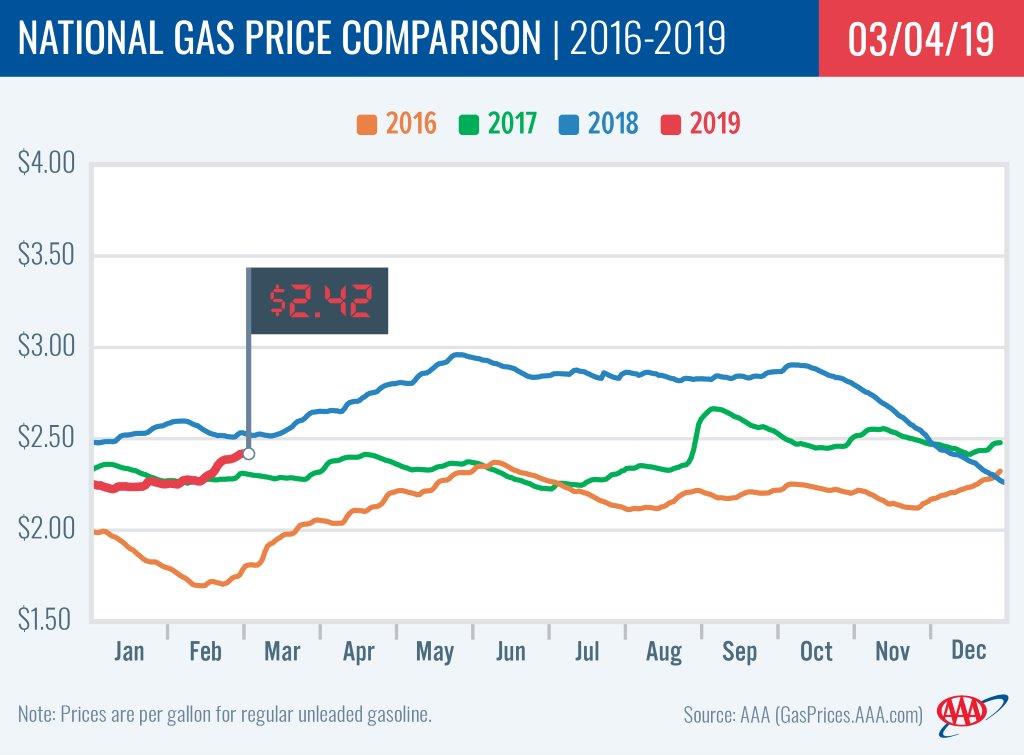
PORTLAND, Ore., – Pump prices are moving higher this week due to reduced supplies and increased demand. For the week, the national average gains three cents to $2.43 a gallon. The Oregon average adds two and a half cents to $2.77.
Since the start of the year, the national average has shot up 17 cents. This is the largest jump during the January/February timeframe since 2015. Pump prices rose steadily in many states last month as a number of refineries underwent planned and unplanned maintenance. In addition, higher crude oil prices put upward pressure on fuel prices. Last year, the national average added only four cents between Jan. 1 and March 5.
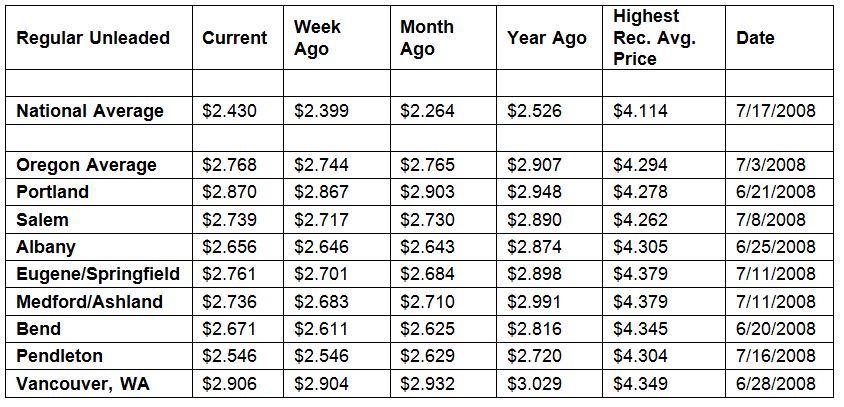
Oregon’s gas prices have fallen about 18 cents since the start of the year. On January 1, the Oregon average was nearly $2.95. Last year, the Oregon average added 12 cents between Jan. 1 and March 5.
“We’re at the time of year when pump prices normally move up as refineries prepare for maintenance season ahead of the production of summer-blend fuel,” says Marie Dodds, public affairs director for AAA Oregon/Idaho.
Oregon is one of 48 states and the District of Columbia where gas prices are higher now than a week ago. Alabama (+10 cents) and Mississippi (+8 cents) have the largest weekly increases. Wyoming and North Carolina are the only two states with weekly decreases and both of those averages are only fractions of a cent lower than a week ago. This week two states, Hawaii and California, have averages at or above $3 a gallon, same as a week ago.
Oregon is one of 44 states and the District of Columbia with higher prices now than a month ago. The national average is 17 cents more and the Oregon average is fractions of a cent more than a month ago. Minnesota (+32 cents) has the largest monthly jump. Utah (-11 cents) has the largest month-over-month decrease.
The West Coast continues to have some of the most expensive gas prices in the nation with most of the region’s states landing on the top 10 most expensive list. Hawaii tops the list, followed by California, Washington, Nevada, Alaska and Oregon rounding out the top six. Oregon is sixth most expensive for the ninth week in a row. Arizona ($2.43) is the only state in the region that dropped from the 10 most expensive markets list. Prices in the region have mostly increased on the week, with Oregon (+2.5 cents) seeing the largest jump.
| Rank | Region | Price on 3/5/19 | |
| 1 | Hawaii | $3.31 | |
| 2 | California | $3.30 | |
| 3 | Washington | $2.88 | |
| 4 | Nevada | $2.84 | |
| 5 | Alaska | $2.80 | |
| 6 | Oregon | $2.77 | |
| 7 | Pennsylvania | $2.65 | |
| 8 | District of Columbia | $2.60 | |
| 9 | New York | $2.55 | |
| 10 | Connecticut | $2.52 |
The recent weekly report from the U.S. Energy Information Administration (EIA) showed that West Coast gasoline stocks fell slightly by 100,000 bbl. They now sit at 32.7 million bbl. Stocks are approximately 500,000 bbl higher than at this time last year, which could help stabilize prices if there is a supply challenge in the region this week.
The nation’s cheapest markets are Missouri ($2.17) and Arkansas ($2.19). For the third week in a row, no states have an average below $2 a gallon.
Oregon is one of 48 states and the District of Columbia where drivers are paying less than a year ago to fill up. The national average is 10 cents less and the Oregon average is 14 cents less than a year ago. Alaska (-28 cents) has the greatest year-over-year decrease; Nevada (+4 cents) and Arizona (+4 cents) are the only states with year-over-year increases.
Oil Market Dynamics
Oil prices took a downward turn last week due to concerns that global crude demand may be lower than expected. Moving into this week, crude prices may rise on optimism that the U.S. and China are closer to a deal that resolves the ongoing trade spat between two of the world’s largest economies. Tightened global supply due to OPEC’s 1.2 million b/d production reduction agreement (which will be through June 2019) and decreased crude exports from Venezuela and Iran could also help prices increase.
Earlier last week, crude prices rallied after EIA revealed that domestic crude inventories decreased last week by 8.6 million bbl and now sit at 445.9 million bbl. The week-over-week reduction is the largest so far in 2019 and was driven largely by a robust crude export rate of 3.4 million b/d, which is more than double the export rate at this time last year. Additionally, the U.S. saw a low crude import rate at 5.9 million b/d last week, which is the lowest rate since February 1996. Low imports also contributed to lower crude inventory levels.
In related news, Baker Hughes Inc. reported that the U.S. lost 10 oilrigs last week, bringing the total to 843. When compared to last year at this time, there are 43 more rigs this year.
At the close of Friday’s formal trading session on the NYMEX, WTI dropped $1.42 to settle at $55.80. At the close of Monday’s formal trading session on the NYMEX, WTI added 79 cents to settle at $56.59. Today crude is trading around $56, same as a week ago. Crude prices are up about three percent in the last month and are about $5 per barrel lower than a year ago.
Drivers can find current gas prices along their route with the free AAA Mobile app for iPhone, iPad and Android. The app can also be used to map a route, find discounts, book a hotel and access AAA roadside assistance. Learn more at AAA.com/mobile.
Diesel
For the week, the national average adds two and a half a cents to just under $3.00 a gallon. Oregon’s average gains one and a half cents to $3.08. A year ago the national average for diesel was $2.95 and the Oregon average was $3.07.
Find current fuel prices at GasPrices.AAA.com.
AAA news releases, high resolution images, broadcast-quality video, fact sheets and podcasts are available on the AAA NewsRoom at NewsRoom.AAA.com.