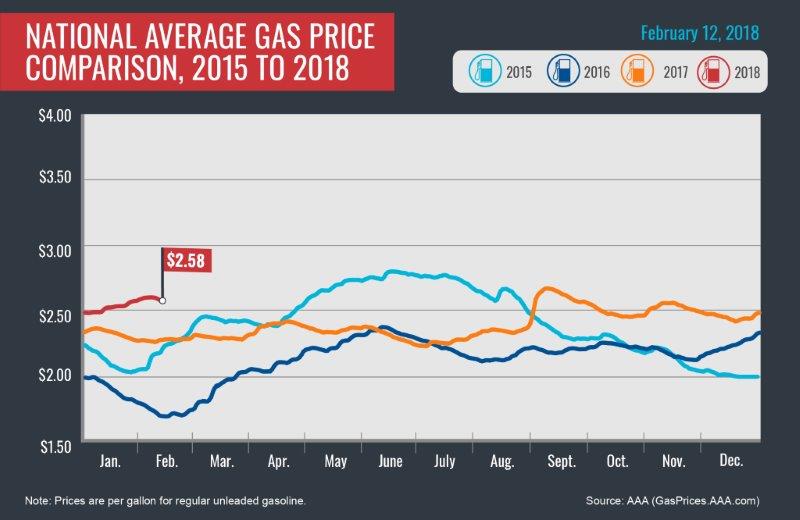
PORTLAND, Ore., – Retail pump prices are lower this week in Oregon and most other states, due in part to falling crude oil prices. For the week, the national average for regular unleaded loses four cents to $2.57 a gallon while the Oregon average dips a penny to $2.88. It’s the first week-over-week decline for gas prices in 2018.
Crude oil prices began 2018 above $60 per barrel and stayed there until last week when crude prices plunged by about five percent to close around $59 on Friday, the worst weekly decline for crude oil in two years.
“It’s too early to know if this one-week decline in pump prices is the start of a cheaper gas price trend, but at least consumers get a week with decreasing or steady pump prices,” says Marie Dodds, public affairs director for AAA Oregon/Idaho. “Until this week, gas prices had climbed steadily since Christmas.”
Demand for gasoline continues to be strong. The latest report from the U.S. Energy Information Administration (EIA) shows gasoline at its highest level this year at 9.1 million b/d, a 169,000 b/d increase year-over year. Gasoline inventories also increased by 3.4 million bbl to total 245.5 million bbl, which sits about 1.4 million bbl above the five-year average.
Oregon is one of 45 states and the District of Columbia where gas prices are lower week-over-week. The largest decreases are in Indiana (-14 cents) and Ohio (-11 cents). The largest weekly increase is in Hawaii (+5 cents).
Oregon is one of 45 states and the District of Columbia where prices are higher now than a month ago. The national average is four cents more and the Oregon average is six cents more than a month ago. The largest monthly increases are in Florida (+18 cents) and California (+17 cents). The largest monthly decrease is in Indiana (-19 cents).
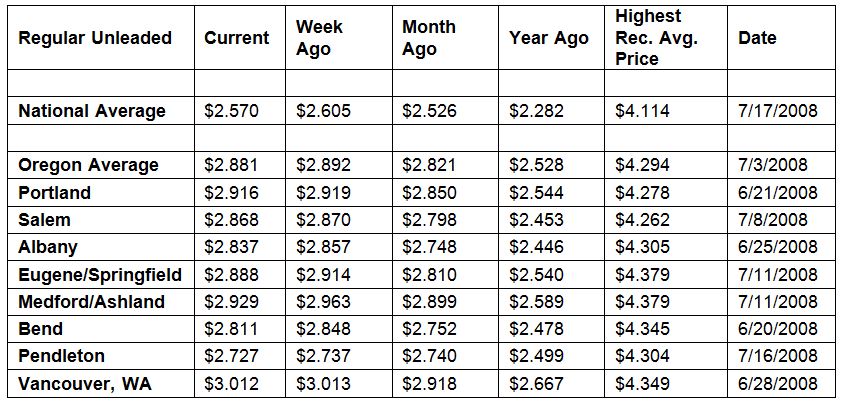
The West Coast still has the most expensive gas prices in the nation with six of the top ten markets in this region. Hawaii tops the list, followed by California, Alaska and Washington. These states are the only four with averages at or above $3 a gallon. Oregon is fifth most expensive for the second week in a row.
| Rank | Region | Price on 2/13/18 | |
| 1 | Hawaii | $3.45 | |
| 2 | California | $3.34 | |
| 3 | Alaska | $3.04 | |
| 4 | Washington | $3.00 | |
| 5 | Oregon | $2.88 | |
| 6 | Pennsylvania | $2.86 | |
| 7 | Nevada | $2.79 | |
| 8 | District of Columbia | $2.78 | |
| 9 | New York | $2.76 | |
| 10 | Connecticut | $2.74 |
According to the EIA, gasoline stocks in the West Coast region surged to a five-year peak – increasing by 1.1 million bbl. Inventories of gasoline now sit at 35 million bbl, which is unusually high for this region at this time of the year. Last year at this time, stocks were about 5 million bbl lower than the present level. This should help keep pump prices fairly stable in the short-term.
The nation’s cheapest markets are Texas ($2.33) and Mississippi ($2.33). For the 29th week in a row, no states have an average below $2.
Drivers in all 50 states and the District of Columbia are paying are paying more than a year ago to fill up. The national average is 29 cents more and the Oregon average is 35 cents more than a year ago. This is the third-largest yearly increase in the country. California has the greatest year-over-year increase of 46 cents; New Jersey is second at 35 cents.
Oil Market Dynamics
Crude oil prices started the year above $60 per barrel and that’s where they remained until last week. Price gains made throughout January, which saw a closing high of $66.27, were wiped away after trading last week. Last week’s losses, which were buoyed by a strengthening dollar, may continue into this week after EIA’s latest weekly petroleum report revealed that U.S. crude production hit 10.25 million b/d – a new record weekly production rate.
The continuing growth in U.S. crude oil production may give the market some pause as it continues to assess the long-term impact of OPEC’s production reduction agreement, which remains in effect through the end of 2018. On the other hand, OPEC’s latest forecast for oil demand projects that global oil demand will increase by 1.59 million b/d. The estimate is an increase of 60,000 b/d from last year, which may help to drain growing oil exports from the U.S.
A sign of potentially explosive growth in U.S. crude production, the latest Baker Hughes, Inc. report found the active oil rig count in the U.S. grew by 26 new rigs last week to total at 791. This is the highest number of active rigs since April 2015, and it will likely push production to even higher levels later this year.
At the close of Friday’s formal trading session on the NYMEX, WTI dropped by nearly $2 to settle at $59.20. At the close of Monday’s formal trading session on the NYMEX, WTI added nine cents to settle at $59.29. Today crude is trading around $59, compared to $64 a week ago. Crude prices are down about seven percent in the last month and are about $5 less per barrel than a year ago.
Drivers can find current gas prices along their route with the free AAA Mobile app for iPhone, iPad and Android. The app can also be used to map a route, find discounts, book a hotel and access AAA roadside assistance. Learn more at AAA.com/mobile.
Diesel
For the week, the national average slips a penny to $2.99 a gallon. Oregon’s average dips half a cent to $3.08. A year ago the national average for diesel was $2.51 and the Oregon average was $2.67.
Find current fuel prices at GasPrices.AAA.com.
AAA news releases, high resolution images, broadcast-quality video, fact sheets and podcasts are available on the AAA NewsRoom at NewsRoom.AAA.com.