Minimal movement in all states this week
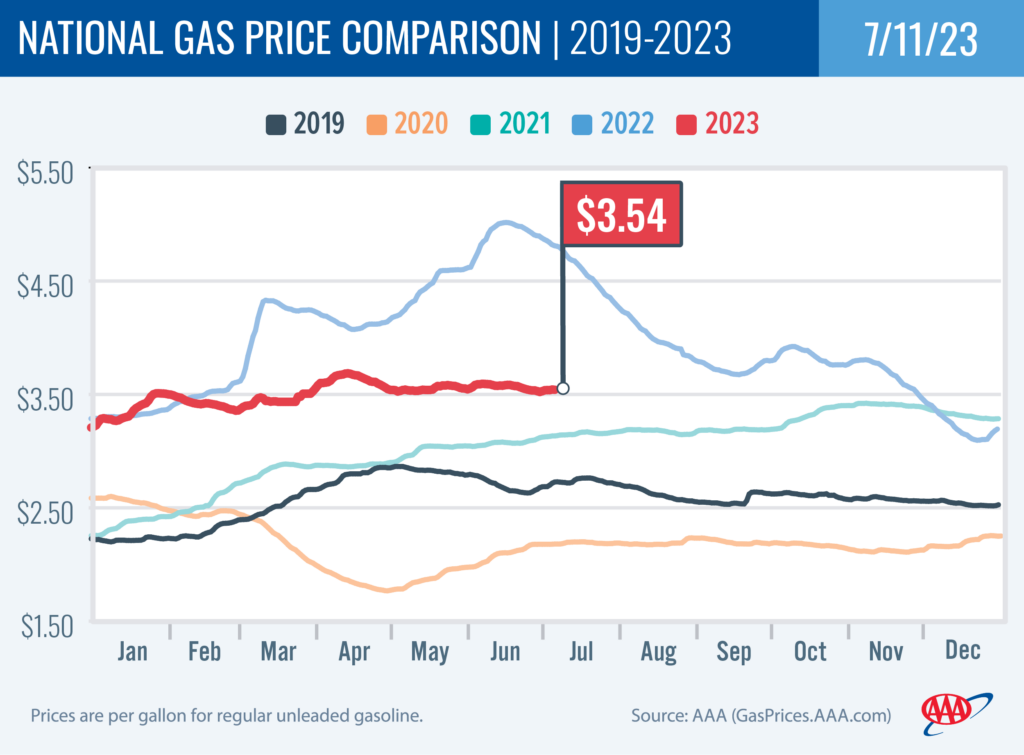
PORTLAND, Ore., – The national average is barely budging this week. About half of all states, including Oregon, are seeing small declines on the week, while the other half are seeing small to moderate increases. Crude oil prices have been inching up so that could put upward pressure on pump prices. For the week, the national average for regular adds a penny to $3.54. The Oregon average slips two cents to $4.62.
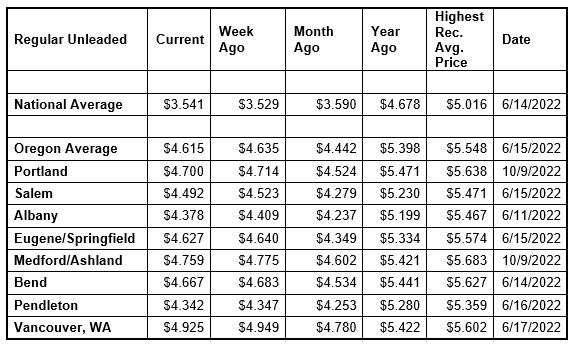
“The national average has remained between $5.51 and $5.61 per gallon since late April. The Oregon average has shown more upward momentum during this time, climbing from $4.11 a gallon on April 30 to a year-to-date high of nearly $4.65 on June 28,” says Marie Dodds, public affairs director for AAA Oregon/Idaho.
Crude oil prices have climbed to nearly $75 per barrel today, the highest price since May 24. West Texas Intermediate had been in the upper $60 to low $70 range for the past six weeks. Oil prices were boosted on concerns that supplies could remain tight for the remainder of 2023 and also by Saudi Arabia’s move to extend its production cuts of one million barrels per day to August.
Crude oil is trading around $74 today compared to $70 a week ago and $104 a year ago. In June, West Texas Intermediate ranged between about $67 and $73 per barrel. In May, WTI ranged between about $63 and $77 per barrel. In April, WTI ranged between about $73 and $83. In March, WTI ranged between about $64 and $81 per barrel. In February, WTI ranged between about $73 and $80 per barrel. In January, WTI ranged between about $73 and $82 bbl. Crude reached recent highs of $123.70 on March 8, 2022, shortly after the Russian invasion of Ukraine, and $122.11 per barrel on June 8, 2022. The all-time high for WTI crude oil is $147.27 in July 2008.
Crude oil is the main ingredient in gasoline and diesel, so pump prices are impacted by crude prices on the global markets. On average, about 56% of what we pay for in a gallon of gasoline is for the price of crude oil, 20% is refining, 11% distribution and marketing, and 14% are taxes, according to the U.S. Energy Information Administration.
Demand for gasoline in the U.S. rose to its highest level of the year so far. The Energy Information Administration (EIA) says demand increased from 9.32 million b/d to 9.60 million b/d for the week ending June 30. This compares to 9.41 million b/d a year ago. Meanwhile, total domestic gasoline stocks decreased by 2.5 million bbl to 219.5 million bbl. Rising gas demand amid decreasing supply will likely push pump prices higher.
Quick stats
Oregon is one of 26 states with lower prices now than a week ago. Florida (+19 cents) has the largest weekly jump. Utah (-8 cents) has the largest weekly decrease. The averages in Alaska and Montana are flat.
Washington ($4.96) has the most expensive gas in the nation for the fourth week in a row. California ($4.88) is second, Hawaii ($4.70) is third, Oregon ($4.62) is fourth, Alaska ($4.30) is fifth, and Nevada ($4.23) is sixth. These are the six states with averages at or above $4 a gallon, same as a week ago. This week 43 states and the District of Columbia have averages in the $3-range. Only one state, Mississippi ($2.98) has an average in the $2 range this week.
The cheapest gas in the nation is in Mississippi ($2.98) and Louisiana ($3.09). For the 130th week in a row, no state has an average below $2 a gallon.
The difference between the most expensive and least expensive states is $1.98 this week, same as a week ago.
Oregon is one of 20 states and the District of Columbia with higher prices now than a month ago. The national average is five cents less and the Oregon average is 17 cents more than a month ago. This is the third-largest monthly increase in the nation. Colorado (+30 cents) and Alaska (+27 cents) have the largest monthly jumps. Arizona (-52 cents) has the largest monthly drop. The averages in New Hampshire, Kansas and Georgia are flat month-over-month.
All 50 states and the District of Columbia have lower prices now than a year ago. The national average is $1.14 less and the Oregon average is 78 cents less than a year ago. Indiana (-$1.44) has the largest yearly drop. Washington (-40 cents) has the smallest. Last year, pump prices rose rapidly after the Russian invasion of Ukraine.
West Coast
The West Coast region continues to have the most expensive pump prices in the nation with six of the seven states in the top 10. It’s typical for the West Coast to have six or seven states in the top 10 as this region tends to consistently have fairly tight supplies, consuming about as much gasoline as is produced. In addition, this region is located relatively far from parts of the country where oil drilling, production and refining occurs, so transportation costs are higher. And environmental programs in this region add to the cost of production, storage and distribution.
| Rank | Region | Price on 7/11/23 |
| 1 | Washington | $4.96 |
| 2 | California | $4.88 |
| 3 | Hawaii | $4.70 |
| 4 | Oregon | $4.62 |
| 5 | Alaska | $4.30 |
| 6 | Nevada | $4.23 |
| 7 | Idaho | $3.93 |
| 8 | Utah | $3.84 |
| 9 | Illinois | $3.83 |
| 10 | Colorado | $3.79 |
As mentioned above, Washington has the most expensive gas in the nation for the fourth week in a row. California, Hawaii, Oregon, Alaska and Nevada round out the top six. Arizona is 11th. Oregon is fourth for the fifth week in a row.
States in the West Coast region are seeing small to moderate changes on the week, just like every other state: Arizona (-7 cents), California (+4 cents), Washington (-2 cents), Hawaii (-2 cents), Oregon (-2 cents), and Nevada (+1 cent).
The refinery utilization rate on the West Coast rose from 93.5% to 91.7% for the week ending June 30. This rate has ranged between about 73% to 95% in the last year. The latest national refinery utilization rate is 91.1%.
According to EIA’s latest weekly report, total gas stocks in the region decreased from 29.21 million bbl. to 27.90 million bbl.
A lower refinery utilization rate and a decrease in gasoline stocks can put upward pressure on pump prices.
Oil market dynamics
Crude oil prices have increased over the last week due to market concerns that supply may be tight through the remainder of 2023. However, price increases have been capped due to ongoing market fears that a recession will occur. If a recession occurs, oil demand and prices will likely decline. Additionally, the EIA reported that total domestic commercial crude inventories decreased by 1.5 million bbl to 452.2 million bbl.
At the close of Friday’s formal trading session, WTI rose $2.06 to settle at $73.86. At the close of Monday’s formal trading session, WTI lost 87 cents to settle at $72.99. Today crude is trading around $74, compared to $70 a week ago. Crude prices are about $32 less than a year ago.
Drivers can find current gas prices along their route with the free AAA Mobile app for iPhone, iPad and Android. The app can also be used to map a route, find discounts, book a hotel and access AAA roadside assistance. Learn more at AAA.com/mobile.
Diesel
For the week, the national average holds steady at $3.84 a gallon. The record high is $5.816 set on June 19, 2022. The Oregon average remains at $4.42. The record high is $6.47 set on July 3, 2022. A year ago the national average for diesel was $5.64 and the Oregon average was $6.43.
Find current fuel prices at GasPrices.AAA.com.
AAA news releases, high resolution images, broadcast-quality video, fact sheets and podcasts are available on the AAA NewsRoom at NewsRoom.AAA.com.
Find local news releases at https://oregon.aaa.com/community/media/media-contacts.html
Fuel prices are updated daily at AAA’s Daily Fuel Gauge at AAA Gas Prices. For more info go www.AAA.com. AAA Oregon/Idaho provides more than 880,000 members with travel, insurance, financial and automotive-related services, and is an affiliate of AAA National, serving more than 63 million motorists in North America.