U.S. hits another record high in crude production
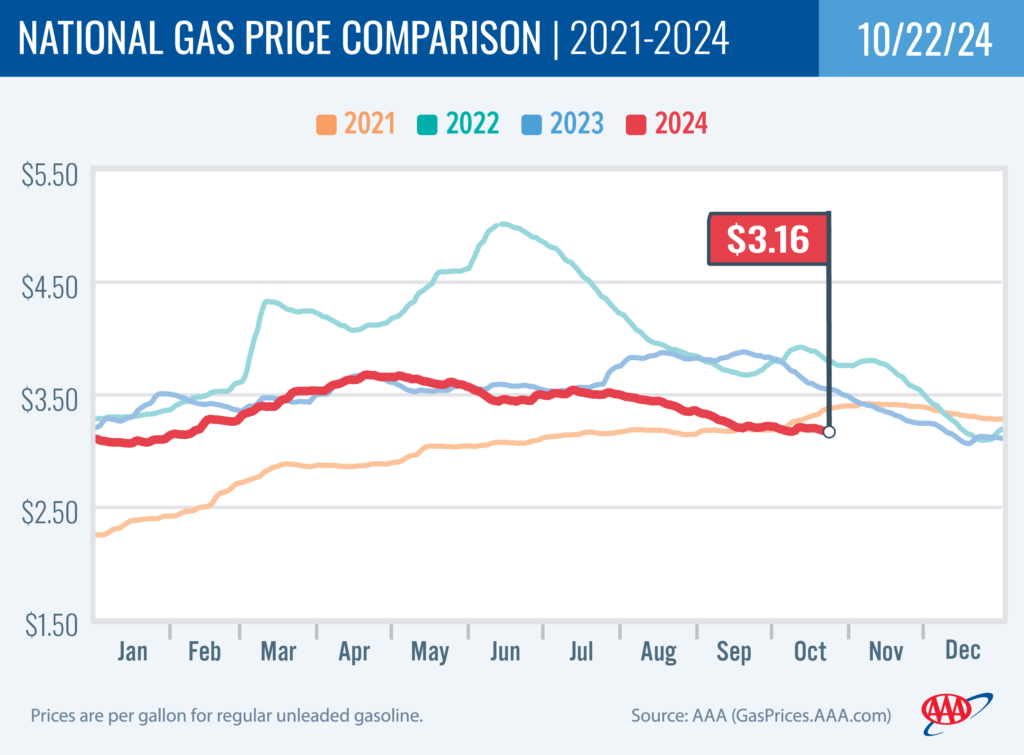
PORTLAND, Ore., – Pump prices have resumed their seasonal declines now that the rally in crude oil prices has stalled. Crude oil is back down to the low $70s per barrel, and that’s helping to push pump prices lower in most states, including Oregon. For the week, the national average for regular loses four cents to $3.16 a gallon. The Oregon average slips a penny to $3.67 a gallon.
Meanwhile, the U.S. has hit another record high in crude oil production. The U.S. Energy Information Administration (EIA) reports that crude production in this country climbed to 13.5 million barrels per day for the week ending Oct. 11. The previous record was 13.4 million barrels per day set the previous week and in August. The U.S. is the top producer of crude oil in the world and has been increasing its oil production since about 2009.
The U.S. price of crude oil (West Texas Intermediate) remained in the low $70s range last week, after Israel said it would not strike Iran’s oil facilities and would instead target military sites. This has eased concerns of an oil production disruption in the Middle East.
“As AAA predicted last week, gas prices are again moving lower in most states and the national average is getting closer to $3 a gallon. Still, crude oil prices will likely remain volatile, depending on what happens in the Middle East,” says Marie Dodds, public affairs director for AAA Oregon/Idaho.
The Oregon average began 2024 at $3.79 a gallon compared to $3.67 today. Its lowest price so far this year is $3.58 on February 14 and the highest is nearly $4.51 on May 1. The national average started the year at $3.11 and is at $3.16 today. Its lowest price so far this year is just under $3.07 on January 15 and the highest is just under $3.68 on April 19.
This week, only one Oregon county still has an average above $4 a gallon: Wallowa ($4.14), same as a week ago.
Gas prices typically drop in the fall, due to the switch from summer-blend to winter-blend fuel, which costs less to produce. The switch starts in September. Many areas, including Oregon, can sell winter-blend fuel starting September 15. However, Northern and Southern California require summer-blend fuel through October 31.
Crude prices are impacted by economic news as well as geopolitical events around the world including the unrest in the Middle East and the war between Russia and Ukraine. In addition, production cuts by OPEC+ have tightened global crude oil supplies, which will continue to impact prices. Hurricane season can also impact crude oil prices, if a major storm impacts infrastructure in the Gulf of Mexico. Hurricane season runs from June 1 to November 30.
The price of crude oil reached the year-to-date high of nearly $87 per barrel on April 5. Major drivers of elevated crude prices have been the unrest in the Middle East, the decision by OPEC+ to keep oil production cuts in place, and Ukrainian attacks on Russian refineries. Russia is a top global oil producer, behind the U.S. and Saudi Arabia, and the refinery attacks have reduced output. Crude prices have been volatile after the attack on Israel by Hamas in October 2023. While Israel and the Palestinian territory are not oil producers, concerns remain that the conflict could spread in the Middle East, which could potentially impact crude production in other oil-producing nations in the region.
Crude oil is trading around $72 today compared to $71 a week ago and $85 a year ago. In 2023, West Texas Intermediate ranged between $63 and $95 per barrel. Crude reached recent highs of $123.70 on March 8, 2022, shortly after the Russian invasion of Ukraine, and $122.11 per barrel on June 8, 2022. The all-time high for WTI crude oil is $147.27 in July 2008.
Crude oil is the main ingredient in gasoline and diesel, so pump prices are impacted by crude prices on the global markets. On average, about 55% of what we pay for in a gallon of gasoline is for the price of crude oil, 13% is refining, 17% distribution and marketing, and 15% are taxes, according to the U.S. Energy Information Administration.
Demand for gasoline in the U.S. fell from 9.65 million b/d to 8.625 million b/d for the week ending October 11, according to the U.S. Energy Information Administration (EIA). This compares to 8.94 million b/d a year ago. Meanwhile, total domestic gasoline stocks dropped from 214.9 million barrels to 212.7, while gasoline production decreased last week, averaging 9.3 million barrels daily compared to 10.2 million barrels the previous week.
As noted above, crude oil production in the U.S. is at 13.5 million barrels per day, according to the EIA. This surpasses the previous record high of 13.4 million barrels per day last reached earlier this month and in August of this year. The U.S. produces more crude oil than any other country, according to the EIA.
If crude oil prices don’t rally again, gas prices should fall. Other factors putting downward pressure on prices include lackluster gasoline demand and cheaper winter-blend fuel.
Quick stats
Oregon is one of 47 states and the District of Columbia where prices are lower now than a week ago. Georgia (+22 cents) has the biggest week-over-week increase in the nation. Ohio (-18 cents) has the largest weekly decrease.
California ($4.63) has the most expensive gas in the nation for the seventh week in a row. Hawaii ($4.59) is second, and Washington ($4.07) is third. These are the three states with averages at or above $4 a gallon, same as a week ago. This week 28 states and the District of Columbia have averages in the $3-range. There are 19 states with an average in the $2 range this week.
The cheapest gas in the nation is in Mississippi ($2.73) and Texas ($2.73) and. No state has had an average below $2 a gallon since January 7, 2021, when Mississippi and Texas were below that threshold.
The difference between the most expensive and least expensive states is $1.90 this week, compared to $1.96 a week ago.
Oregon is one of 39 states and the District of Columbia with lower prices now than a month ago. The national average is five cents less and the Oregon average is also five cents less than a month ago. Colorado (-26 cents) has the largest month-over-month drop in the nation. South Carolina (+9 cents) has the largest monthly increase in the nation.
All 50 states and the District of Columbia have lower prices now than a year ago. The national average is 39 cents less and the Oregon average is 79 cents less than a year ago. This is the fourth-largest year-over-year drop in the nation. Arizona (-91 cents) has the largest year-over-year drop.
West Coast
The West Coast region continues to have the most expensive pump prices in the nation with six of the seven states in the top 10. It’s typical for the West Coast to have six or seven states in the top 10 as this region tends to consistently have fairly tight supplies, consuming about as much gasoline as is produced. In addition, this region is located relatively far from parts of the country where oil drilling, production and refining occurs, so transportation costs are higher. And environmental programs in this region add to the cost of production, storage and distribution.
| Rank | Region | Price on 10/22/2024 |
| 1 | California | $4.63 |
| 2 | Hawaii | $4.59 |
| 3 | Washington | $4.07 |
| 4 | Nevada | $3.87 |
| 5 | Oregon | $3.67 |
| 6 | Alaska | $3.62 |
| 7 | Utah | $3.44 |
| 8 | Idaho | $3.40 |
| 9 | Illinois | $3.39 |
| 10 | Pennsylvania | $3.33 |
As mentioned above, California ($4.63) has the most expensive gas in the country. Hawaii, Washington, Nevada, Oregon, and Alaska round out the top six. Arizona ($3.29) is 11th. Oregon is fifth for the 10th week in a row.
All seven states in the West Coast region are seeing small declines in gas prices on the week: Arizona (-5 cents), California (-5 cents), Nevada (-5 cents), Oregon (-1 cent), Hawaii (-1/2 cent), Washington (-3/10ths of a cent) and Alaska (-2/10ths of a cent).
The refinery utilization rate on the West Coast climbed from 85.0% to 86.3% for the week ending October 11. This rate has ranged between about 74% to % in the last year. The latest national refinery utilization rate rose from 86.7% to 87.7%. The refinery utilization rate measures how much crude oil refineries are processing as a percentage of their maximum capacity. A low or declining rate can put upward pressure on pump prices, while a high or rising rate can put downward pressure on pump prices.
According to EIA’s latest weekly report, total gas stocks in the region fell from 26.80 million bbl. to 25.92 million bbl.
An increase in the refinery utilization rate and/or a high rate can put downward pressure on pump prices, and a decrease in gasoline stocks can put upward pressure on pump prices.
Oil market dynamics
Crude oil prices (West Texas Intermediate) fell about 8% last week as fears eased that the conflict in the Middle East would widen. Israel said it would not target Iran’s oil infrastructure in retaliation for Iran’s missile attack on Israel three weeks ago. WTI had climbed above $77 per barrel on October 7 on concerns that a widening conflict in the Middle East could impact oil supplies. Another factor weighing on crude oil prices is softer demand out of China. Meanwhile, the EIA reports that crude oil inventories decreased by 2.2 million barrels from the previous week. At 420.5 million barrels, U.S. crude oil inventories are about 5% below the five-year average for this time of year.
At the close of Friday’s formal trading session, WTI fell $1.45 cents to settle at $69.22. At the close of Monday’s formal trading session, WTI rose $1.34 to settle at $70.56. Today crude is trading around $72 compared to $71 a week ago. Crude prices are about $13 less than a year ago.
Drivers can find current gas prices along their route with the free AAA Mobile app for iPhone, iPad and Android. The app can also be used to map a route, find discounts, book a hotel and access AAA roadside assistance. Learn more at AAA.com/mobile.
Diesel
For the week, the national average declines two cents to $3.59 a gallon. The record high is $5.816 set on June 19, 2022. The Oregon average ticks down one cent to $3.93. The record high is $6.47 set on July 3, 2022. A year ago the national average for diesel was $4.50 and the Oregon average was $5.00.
Find current fuel prices at GasPrices.AAA.com.
AAA news releases, high resolution images, broadcast-quality video, fact sheets and podcasts are available on the AAA NewsRoom at NewsRoom.AAA.com.
Find local news releases at https://oregon.aaa.com/community/media/media-contacts.html
Fuel prices are updated daily at AAA’s Daily Fuel Gauge at AAA Gas Prices. For more info go www.AAA.com. AAA Oregon/Idaho provides more than 910,000 members with travel, insurance, financial and automotive-related services, and is an affiliate of AAA National, serving more than 65 million members in North America.