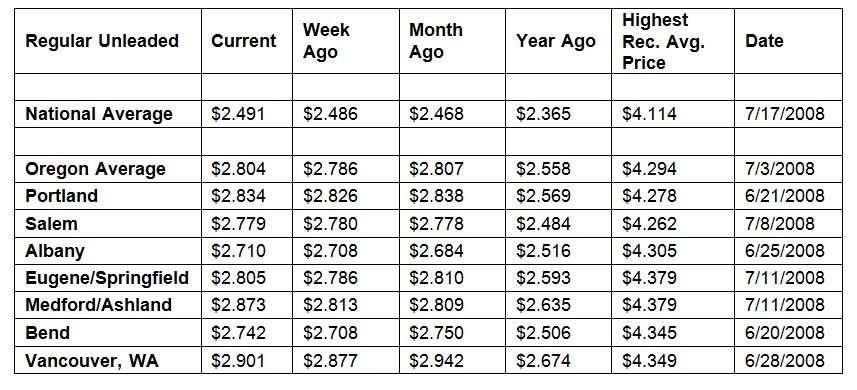
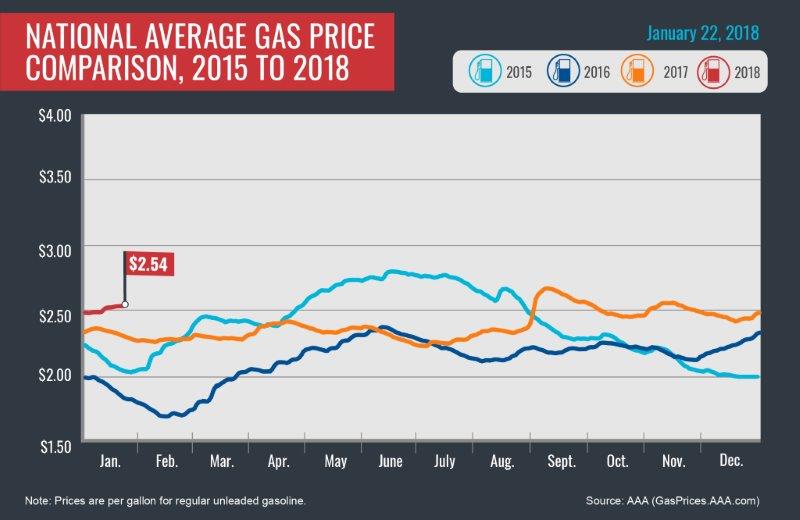
PORTLAND, Ore., – Pump prices have been ticking up since the start of the year signaling that gas prices may be more expensive in 2018 than last year. For the week, the national average for regular unleaded bumps up a penny to $2.54 a gallon while the Oregon average tacks on half a cent to $2.83.
The U.S. Energy Information Administration (EIA) reports that gasoline demand modestly decreased (146,000 b/d) and gasoline inventory increased by 3.6 million bbl. These two factors had minimal impact on the national average this week.
“This is normally the time of year when gas prices decrease or at least remain steady. Since 2014, pump prices decreased by as much as 20 cents in the first three weeks of the year. This year, gas prices have risen steadily since Jan. 1, indicating that prices in 2018 may very well be more expensive than last year,” says Marie Dodds, public affairs director for AAA Oregon/Idaho. “Of course, the big question for consumers is how high pump prices will go.”
Oregon is one of 43 states and the District of Columbia where gas prices are higher week-over-week. The largest increases are in Florida, North Dakota and Hawaii where prices are a nickel more than a week ago. The largest weekly decrease is in Michigan (-10 cents).
Oregon is one of 43 states and the District of Columbia where gas prices are higher now than a month ago. The national average is 10 cents more and the Oregon average is four cents more than a month ago. The largest monthly increase is in Florida (+19 cents). The largest monthly decrease is in Alaska (-6 cents).
The West Coast still has the most expensive gas prices in the nation with six of the top ten markets in this region. Hawaii has the most expensive gasoline in the country, followed by California and Alaska. These states remain the only three with averages at or above $3 a gallon. Washington is fourth. Oregon falls to sixth most expensive, after spending the last 29 weeks at fifth.
| Rank | Region | Price on 1/23/18 | |
| 1 | Hawaii | $3.35 | |
| 2 | California | $3.20 | |
| 3 | Alaska | $3.07 | |
| 4 | Washington | $2.94 | |
| 5 | Pennsylvania | $2.83 | |
| 6 | Oregon | $2.83 | |
| 7 | District of Columbia | $2.75 | |
| 8 | New York | $2.71 | |
| 9 | Connecticut | $2.69 | |
| 10 | Nevada | $2.69 |
Total gasoline stocks in the West Coast increased by 1.2 million bbl, landing at 34.7 million bbl. According to the EIA, it is the highest inventory level in the region in four years, since the week of January 17, 2014. These plentiful supplies are a factor in keeping gas prices in this region relatively steady on the week.
The nation’s cheapest markets are Missouri ($2.30) and Texas ($2.29). For the 26th week in a row, no states have an average below $2.
Drivers are paying more than a year ago to fill up. The national average is 24 cents more and the Oregon average is 29 cents more than a year ago. This is the fifth-largest yearly increase in the country. Indiana has the greatest year-over-year increase of 44 cents; California is second at 40 cents, Michigan is third at 32 cents and Alaska is fourth at 29 cents.
Oil Market Dynamics
Crude oil prices started the year above $60 per barrel and that’s where they remain. Oil prices slid a bit last week after EIA’s latest petroleum report underscored that domestic crude production in the U.S. continues to grow. On the week, U.S. crude production increased by 258,000 b/d to 9.750 million b/d. Market observers are looking for indications that growth in the global crude market has slowed, but the U.S. has bucked that trend. In fact, U.S. producers are seizing the higher petroleum prices to grow global market share – evidenced by crude exports growing to 1.25 million b/d last week. That figure is up from the rate last year at this time, which stood at 704,000 b/d.
This growth in U.S. production potentially stalls efforts by OPEC and major crude producers to rebalance the market by cutting their production through the end of 2018. However, market observers who are looking for indications that the crude market may tighten in the coming months were glad to see the number of active oil rigs in the U.S. decline by five last week. The total number of rigs now stands at 747.
At the close of Friday’s formal trading session on the NYMEX, WTI dropped 58 cents to settle at $63.37. At the close of Monday’s formal trading session on the NYMEX, WTI gained 12 cents to settle at $63.49. Today crude is trading around $64, same as a week ago. Crude prices are up about eight percent in the last month and are about $11 more per barrel than a year ago.
Drivers can find current gas prices along their route with the free AAA Mobile app for iPhone, iPad and Android. The app can also be used to map a route, find discounts, book a hotel and access AAA roadside assistance. Learn more at AAA.com/mobile.
Diesel
For the week, the national average gains two cents to $2.95 a gallon. Oregon’s average adds half a cent to $3.06. A year ago the national average for diesel was $2.52 and the Oregon average was $2.68.
Find current fuel prices at GasPrices.AAA.com.
AAA news releases, high resolution images, broadcast-quality video, fact sheets and podcasts are available on the AAA NewsRoom at NewsRoom.AAA.com.