National, Oregon averages are on the rise
PORTLAND, Ore., – Pump prices are rising across the country due to refinery maintenance and the switch to summer-blend fuel. Here in the Pacific Northwest, the increases are amplified by the closure of locks on the Columbia River, which has prevented fuel barges from moving through. This has created tight supplies in the Pacific Northwest and soaring gas prices. For the week, the national average for regular jumps 10 cents to $3.37 a gallon. The Oregon average climbs nine cents to $3.86 a gallon. This is the 20th-largest week-over-week gain for a state in the nation.
Maintenance on the locks along the Columbia River in the Pacific Northwest has been one of the reasons for tighter gasoline supplies in the area. Wholesale prices shot up and those increase are being passed on to consumers in higher retail prices. Work is expected to wrap up by the end of March. In addition to the lock closures, refinery maintenance, both planned and unplanned, is underway in the San Francisco Bay area. This is also putting a crimp in supplies and contributing to higher prices on the West Coast.
This is the time of year for the seasonal climb in gas prices due to refinery maintenance and the switch to EPA-mandated summer-blend fuel. California switches earlier than other states, and as a result, supplies have tightened in the West Coast region.
“Things have settled down a little since last week, when the Oregon average for regular had the biggest weekly jump in the nation. But drivers can expect rising prices for the next several weeks due to the temporary decrease in supplies,” says Marie Dodds, public affairs director for AAA Oregon/Idaho. “Demand for gas also rises in March and April due to spring break and milder weather. Growing demand amid tighter supplies put upward pressure on pump prices.”
All counties in Oregon except Curry ($4.17), Harney ($4.02), and Multnomah ($4.04) and have averages below $4 a gallon. The Oregon average began 2024 at $3.79 a gallon compared to $3.86 today. The national average started the year at $3.11 and is at $3.37 today.
Gas prices normally rise in the first and second quarters of the year. The factors include refinery maintenance season, the normal seasonal growth in demand, and the federally mandated switch from winter-blend fuel to summer-blend, which is more expensive to produce. Summer-blend gas helps reduce emissions from gasoline during the warm summer months. More info on summer- and winter-blend gasoline can be found at the EPA website.
Crude oil prices climbed to near $80 per barrel last week and edged higher to start this week after OPEC+ announced Sunday it would extend its voluntary cuts in oil production. The cartel says that the 2.2 million barrels per day of cuts that were planned for the first quarter of this year will continue through June.
Crude prices have been volatile since the attack on Israel by Hamas in October. While Israel and the Palestinian territory are not oil producers, there’ve been concerns that the conflict could spread in the Middle East, which could potentially impact crude production in other oil-producing nations in the region.
Crude oil is trading around $79 today compared to $79 a week ago and $80 a year ago. In 2023, West Texas Intermediate ranged between $63 and $95 per barrel. Crude reached recent highs of $123.70 on March 8, 2022, shortly after the Russian invasion of Ukraine, and $122.11 per barrel on June 8, 2022. The all-time high for WTI crude oil is $147.27 in July 2008.
Crude oil is the main ingredient in gasoline and diesel, so pump prices are impacted by crude prices on the global markets. On average, about 56% of what we pay for in a gallon of gasoline is for the price of crude oil, 8% is refining, 19% distribution and marketing, and 16% are taxes, according to the U.S. Energy Information Administration.
Demand for gas in the U.S. increased from 8.20 million b/d to 8.47 million b/d for the week ending February 23, according to the U.S. Energy Information Administration (EIA). This compares to 9.11 million b/d at the same time last year. Meanwhile, total domestic gasoline stocks declined by 2.8 million bbl to 244.2 million bbl.
Growing demand amid tighter supply has contributed to the increase in pump prices.
Quick stats
Oregon is one of 47 states and the District of Columbia with higher prices now than a week ago. Ohio (+26 cents) has the largest week-over-week gain in the nation. Last week, Oregon had the largest weekly jump for a state in the nation. This week, Oregon has the 20th-largest increase. New Jersey (-1/2 cent) has the biggest weekly decline.
After eight weeks, California ($4.85) bumps Hawaii ($4.71) as the state with the most expensive gas in the nation. Washington ($4.14) is third and Nevada ($4.07) is fourth. These are the only four states with averages at or above $4, up from three states a week ago. This week 40 states and the District of Columbia have averages in the $3-range. Six states have averages in the $2 range this week.
The cheapest gas in the nation is in Mississippi ($2.91) and Texas ($2.94). No state has had an average below $2 a gallon since January 7, 2021, when Mississippi and Texas were below that threshold.
The difference between the most expensive and least expensive states is $1.94 this week, compared to $1.86 a week ago.
All 50 states and the District of Columbia have higher prices now than a month ago. The national average is 22 cents more and the Oregon average is 26 cents more than a month ago. This is the 20th largest monthly gain in the nation. Illinois (+56 cents) has the largest monthly increase.
Oregon is one of 35 states with lower prices now than a year ago. The national average is four cents less and the Oregon average is four cents less than a year ago. Colorado (-$1.00) has the largest yearly decrease. Illinois (+20 cents) has the largest year-over-year increase.
West Coast
The West Coast region continues to have the most expensive pump prices in the nation with all seven states in the top 10. It’s typical for the West Coast to have six or seven states in the top 10 as this region tends to consistently have fairly tight supplies, consuming about as much gasoline as is produced. In addition, this region is located relatively far from parts of the country where oil drilling, production and refining occurs, so transportation costs are higher. And environmental programs in this region add to the cost of production, storage and distribution.
| Rank | Region | Price on 3/5/2024 |
| 1 | California | $4.85 |
| 2 | Hawaii | $4.71 |
| 3 | Washington | $4.14 |
| 4 | Nevada | $4.07 |
| 5 | Oregon | $3.86 |
| 6 | Illinois | $3.75 |
| 7 | Alaska | $3.61 |
| 8 | Pennsylvania | $3.54 |
| 9 | Arizona | $3.51 |
| 10 | District of Columbia | $3.48 |
As mentioned above, California bumps Hawaii as the state with the most expensive gas in the country, and Hawaii slips to second place after eight weeks at number one. Washington, Nevada, and Oregon round out the top five. Alaska is seventh and Arizona is ninth. Oregon is fifth most expensive for the 20th week in a row.
Six of the seven states in the West Coast region are seeing week-over-week increases: California (+19 cents), Nevada (+15 cents), Arizona (+14 cents), Washington (+10 cents), Oregon (+9 cents), and Alaska (+7 cents). Hawaii (-1/10th of a cent) is the only state in the region with a weekly decline.
The refinery utilization rate on the West Coast rose from 74.7% to 76.7% for the week ending February 23. This rate has ranged between about 74% to 97% in the last year. The latest national refinery utilization rate increased from 80.6% to 81.5%. The refinery utilization rate measures how much crude oil refineries are processing as a percentage of their maximum capacity. A low or declining rate can put upward pressure on pump prices.
According to EIA’s latest weekly report, total gas stocks in the region fell from 31.92 million bbl. to 31.25 million bbl.
A higher refinery utilization rate can put downward pressure on pump prices; however, a lower rate can put upward pressure on prices. A decrease in gasoline stocks can put upward pressure on pump prices.
Oil market dynamics
Crude oil prices remain around $79 per barrel. The announcement from OPEC+ on Sunday that the cartel would extend their voluntary cuts in oil output through June helped to prop up prices. Crude prices eased a bit last week after the EIA’s weekly report showed that total domestic commercial crude stocks increased by 4.2 million bbl to 447.2 million bbl last week.
At the close of Friday’s formal trading session, WTI added $1.71 to settle at $79.97. At the close of Monday’s formal trading session, WTI rose $1.71 to close at $79.97. Today crude is trading around $79 compared to $79 a week ago. Crude prices are about $1 less than a year ago.
Drivers can find current gas prices along their route with the free AAA Mobile app for iPhone, iPad and Android. The app can also be used to map a route, find discounts, book a hotel and access AAA roadside assistance. Learn more at AAA.com/mobile.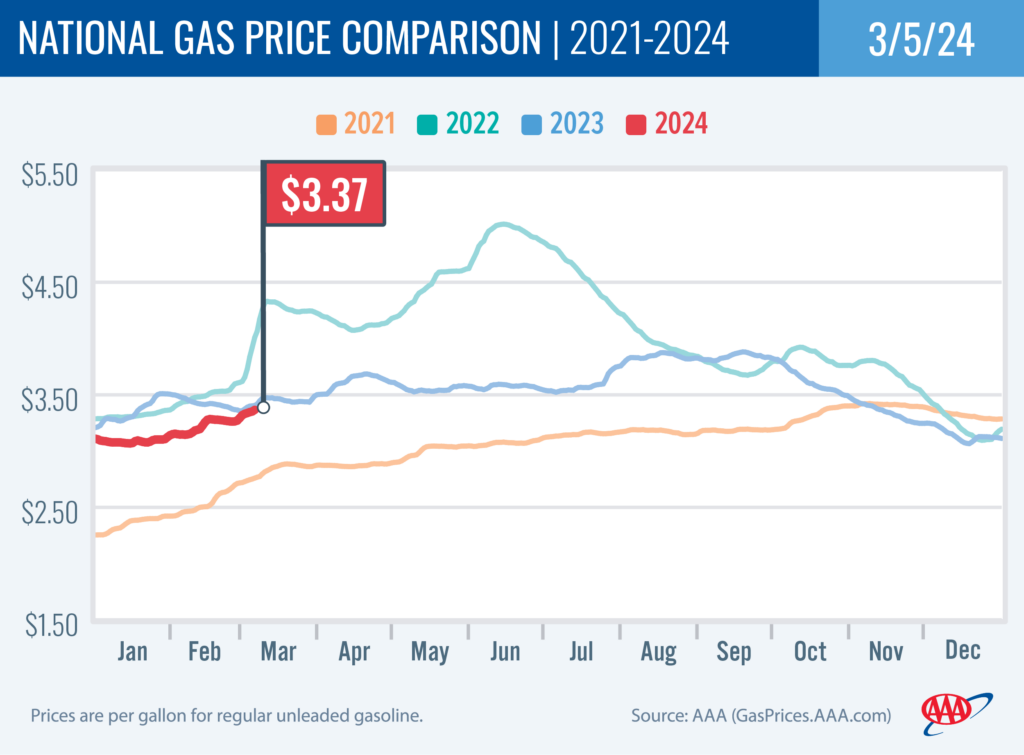
Diesel
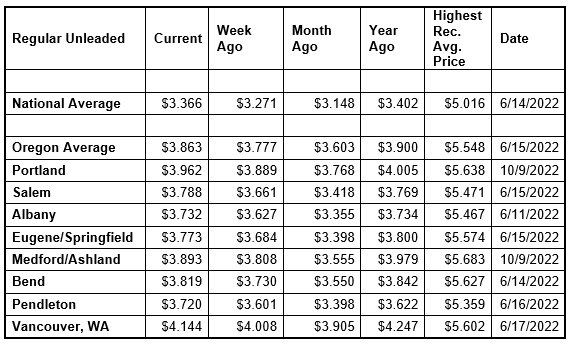
For the week, the national average slips two cents to $4.06 a gallon. The record high is $5.816 set on June 19, 2022. The Oregon average adds two cents to $4.20. The record high is $6.47 set on July 3, 2022. A year ago the national average for diesel was $4.39 and the Oregon average was $4.72.
Find current fuel prices at GasPrices.AAA.com.
AAA news releases, high resolution images, broadcast-quality video, fact sheets and podcasts are available on the AAA NewsRoom at NewsRoom.AAA.com.
Find local news releases at https://oregon.aaa.com/community/media/media-contacts.html
Fuel prices are updated daily at AAA’s Daily Fuel Gauge at AAA Gas Prices. For more info go www.AAA.com. AAA Oregon/Idaho provides more than 890,000 members with travel, insurance, financial and automotive-related services, and is an affiliate of AAA National, serving more than 64 million motorists in North America.