Higher crude prices, seasonal factors push pump prices higher
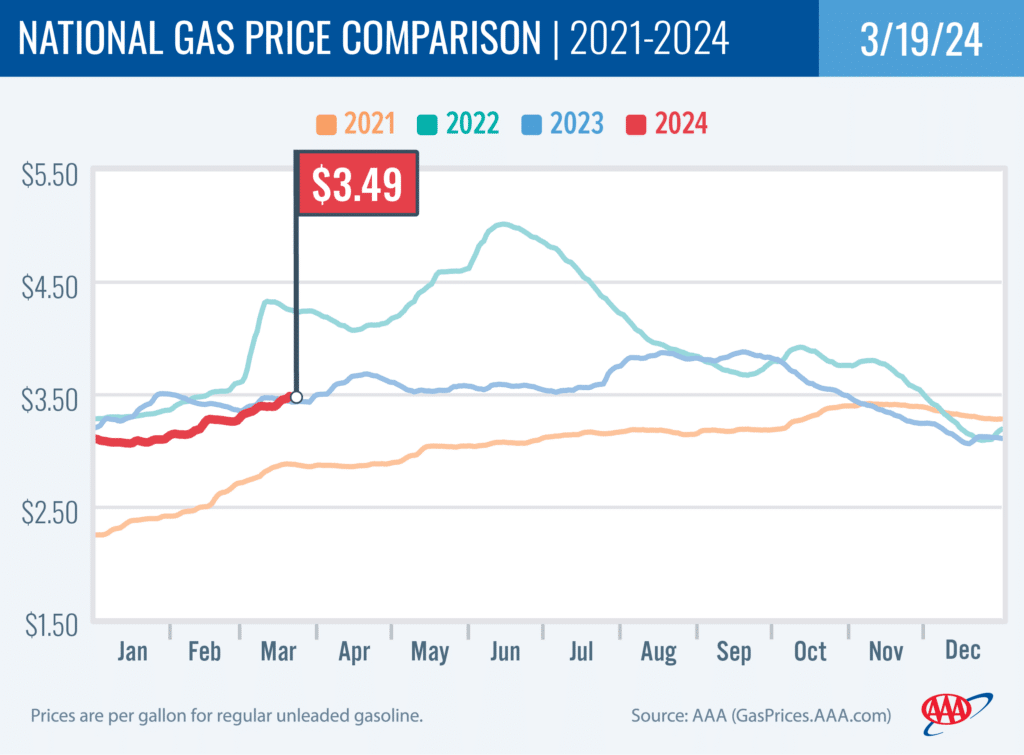
PORTLAND, Ore., – Crude oil prices above $80 per barrel and the seasonal factors of refinery maintenance, the switch to summer-blend fuel, and increased demand for gas are causing pump prices to rise. For the week, the national average for regular climbs 10 cents to $3.49 a gallon. The Oregon average jumps 15 cents to $4.10 a gallon. This is the sixth-largest weekly jump for a state in the nation.
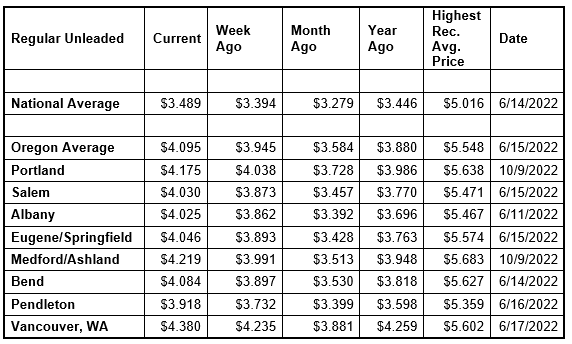
The national average is at its highest price since October. The Oregon average is at its highest price since November.
The Oregon average began 2024 at $3.79 a gallon compared to $4.10 today. Its lowest price so far this year is $3.58 on February 14. The national average started the year at $3.11 and is at $3.49 today. Its lowest price so far this year is just under $3.07 on January 15.
“Gas prices always rise this time of year as refineries undergo maintenance as the switch to summer-blend fuel occurs. And demand for gas increases, also putting upward pressure on prices. In addition, crude oil prices have climbed after drone attacks on Russian refineries,” says Marie Dodds, public affairs director for AAA Oregon/Idaho. “Russia is one of the world’s major oil producers, behind the U.S. and Saudi Arabia, and crude oil prices usually rise when there are conflicts involving a major producer because of the impact on production.”
Many Oregon counties again have averages above $4 a gallon:
Clackamas $4.12
Clatsop $4.08
Columbia $4.20
Coos $4.17
Crook $4.13
Curry $4.32
Deschutes $4.05
Douglas $4.01
Lake $4.21
Harney $4.20
Hood River $4.13
Jackson $4.21
Josephine $4.29
Klamath $4.05
Lake $4.21
Lane $4.03
Marion $4.04
Multnomah $4.11
Tillamook $4.18
Wallowa $4.12
Wasco $4.22
Washington $4.15
Yamhill $4.10
Gas prices normally rise in the first and second quarters of the year. The factors include refinery maintenance season, the normal seasonal growth in demand, and the federally mandated switch from winter-blend fuel to summer-blend, which is more expensive to produce. Summer-blend gas helps reduce emissions from gasoline during the warm summer months. More info on summer- and winter-blend gasoline can be found at the EPA website.
Crude oil prices are at their highest since November. West Texas Intermediate climbed above $80 last Friday and has remained above that benchmark since then. A major driver is the Ukrainian attacks on Russian refineries.
Crude prices were volatile after the attack on Israel by Hamas in October. While Israel and the Palestinian territory are not oil producers, there’ve been concerns that the conflict could spread in the Middle East, which could potentially impact crude production in other oil-producing nations in the region.
Crude oil is trading around $83 today compared to $78 a week ago and $68 a year ago. In 2023, West Texas Intermediate ranged between $63 and $95 per barrel. Crude reached recent highs of $123.70 on March 8, 2022, shortly after the Russian invasion of Ukraine, and $122.11 per barrel on June 8, 2022. The all-time high for WTI crude oil is $147.27 in July 2008.
Crude oil is the main ingredient in gasoline and diesel, so pump prices are impacted by crude prices on the global markets. On average, about 57% of what we pay for in a gallon of gasoline is for the price of crude oil, 11% is refining, 16% distribution and marketing, and 17% are taxes, according to the U.S. Energy Information Administration.
Demand for gas in the U.S. increased slightly from 9.01 to 9.04 million b/d for the week ending March 8, according to the U.S. Energy Information Administration (EIA). This compares to 8.94 million b/d at the same time last year. Meanwhile, total domestic gasoline stocks dropped by 5.6 million bbl to 234.1 million bbl.
Higher gas demand amid tightening supply and higher crude oil prices have pushed pump prices higher.
Quick stats
Oregon is one of 47 states and the District of Columbia with higher prices now than a week ago. New Mexico (+22 cents) has the largest week-over-week gain in the nation. Oregon has the sixth-largest increase. Ohio (-3 cents) has the biggest weekly decline.
California ($4.92) has the most expensive gas in the nation for the third week in a row. Hawaii ($4.70) is second, Washington ($4.33) is third and Nevada ($4.21) is fourth, and Oregon ($4.10) is fifth. These are the five states with averages at or above $4, up from four states a week ago. This week 45 states and the District of Columbia have averages in the $3-range. No states have averages in the $2 range this week.
The cheapest gas in the nation is in Mississippi ($3.05) and Colorado ($3.07). No state has had an average below $2 a gallon since January 7, 2021, when Mississippi and Texas were below that threshold.
The difference between the most expensive and least expensive states is $1.87 this week, compared to $1.94 a week ago.
Oregon is one of 49 states and the District of Columbia with higher prices now than a month ago. The national average is 21 cents more and the Oregon average is 51 cents more than a month ago. This is the largest monthly gain in the nation. Ohio (-1/2 cent) is the only state with a monthly increase.
Oregon is one of 30 states and the District of Columbia with higher prices now than a year ago. The national average is four cents more and the Oregon average is 22 cents more than a year ago. This is the second-largest yearly gain in the nation. Colorado (-72 cents) has the largest yearly decrease. Montana (+28 cents) has the largest year-over-year increase.
West Coast
The West Coast region continues to have the most expensive pump prices in the nation with all seven states in the top 10. It’s typical for the West Coast to have six or seven states in the top 10 as this region tends to consistently have fairly tight supplies, consuming about as much gasoline as is produced. In addition, this region is located relatively far from parts of the country where oil drilling, production and refining occurs, so transportation costs are higher. And environmental programs in this region add to the cost of production, storage and distribution.
| Rank | Region | Price on 3/19/2024 |
| 1 | California | $4.92 |
| 2 | Hawaii | $4.70 |
| 3 | Washington | $4.33 |
| 4 | Nevada | $4.21 |
| 5 | Oregon | $4.10 |
| 6 | Alaska | $3.82 |
| 7 | Illinois | $3.78 |
| 8 | Arizona | $3.71 |
| 9 | Michigan | $3.64 |
| 10 | District of Columbia | $3.63 |
As mentioned above, California has the most expensive gas in the country for the third week in a row. Hawaii, Washington, Nevada, Oregon, and Alaska round out the top six. Arizona is eighth. Oregon is fifth most expensive for the 22nd week in a row.
Six of the seven states in the West Coast region are seeing week-over-week increases: Arizona (+16 cents),
Oregon (+15 cents), Washington (+12 cents), Alaska (+11 cents), Nevada (+9 cents), and California (+4 cents). Hawaii (-1 cent) is the only state in the region with a week-over-week decline.
The refinery utilization rate on the West Coast rose from 80.9% to 82.6% for the week ending March 8. This rate has ranged between about 74% to 97% in the last year. The latest national refinery utilization rate increased from 84.9% to 86.8%. The refinery utilization rate measures how much crude oil refineries are processing as a percentage of their maximum capacity. A low or declining rate can put upward pressure on pump prices.
According to EIA’s latest weekly report, total gas stocks in the region rose from 30.69 million bbl. to 30.99 million bbl.
An increase in the refinery utilization rate can put downward pressure on pump prices; however, a lower percentage can put upward pressure on prices. A decrease in gasoline stocks can put upward pressure on pump prices.
Oil market dynamics
Crude oil prices jumped to four-month highs above $80 per barrel last week after Ukrainian drones hit Russian refineries, reminding markets that the war continues to impact production and fuel supplies. The extent of the damage is unclear, but repairs could curtail Russian petroleum product exports, including diesel, and lead it to import products it needs. Also last week, the International Energy Agency strengthened its 2024 demand outlook for crude oil for the fourth time since November. Additionally, the EIA reported that total domestic commercial crude stocks decreased by 1.5 million bbl to 447 million bbl last week. This week, investors are watching monetary policies in several of the world’s biggest economies, including the U.S., where the Federal Reserve is meeting.
At the close of Friday’s formal trading session, WTI lost 22 cents to settle at $81.04. At the close of Monday’s formal trading session, WTI added $1.68 to close at $82.72. Today crude is trading around $83 compared to $78 a week ago. Crude prices are about $16 more than a year ago.
Drivers can find current gas prices along their route with the free AAA Mobile app for iPhone, iPad and Android. The app can also be used to map a route, find discounts, book a hotel and access AAA roadside assistance. Learn more at AAA.com/mobile.
Diesel
For the week, the national average ticks up half a cent to $4.04 a gallon. The record high is $5.816 set on June 19, 2022. The Oregon average also edges up half a cent to $4.20. The record high is $6.47 set on July 3, 2022. A year ago the national average for diesel was $4.30 and the Oregon average was $4.67.
Find current fuel prices at GasPrices.AAA.com.
AAA news releases, high resolution images, broadcast-quality video, fact sheets and podcasts are available on the AAA NewsRoom at NewsRoom.AAA.com.
Find local news releases at https://oregon.aaa.com/community/media/media-contacts.html
Fuel prices are updated daily at AAA’s Daily Fuel Gauge at AAA Gas Prices. For more info go www.AAA.com. AAA Oregon/Idaho provides more than 890,000 members with travel, insurance, financial and automotive-related services, and is an affiliate of AAA National, serving more than 64 million motorists in North America.