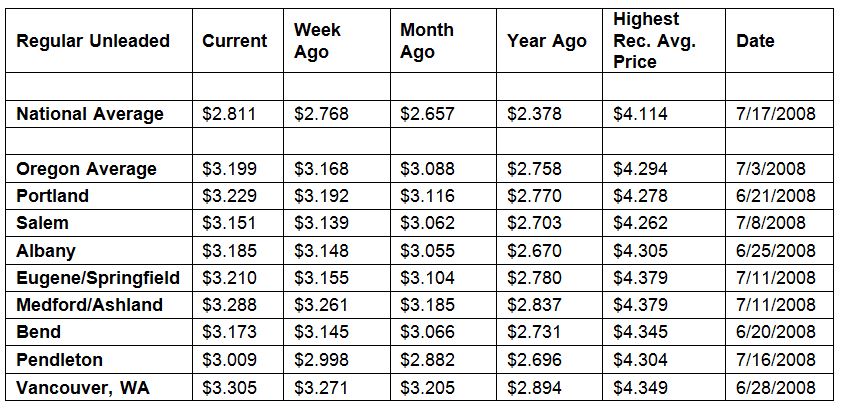
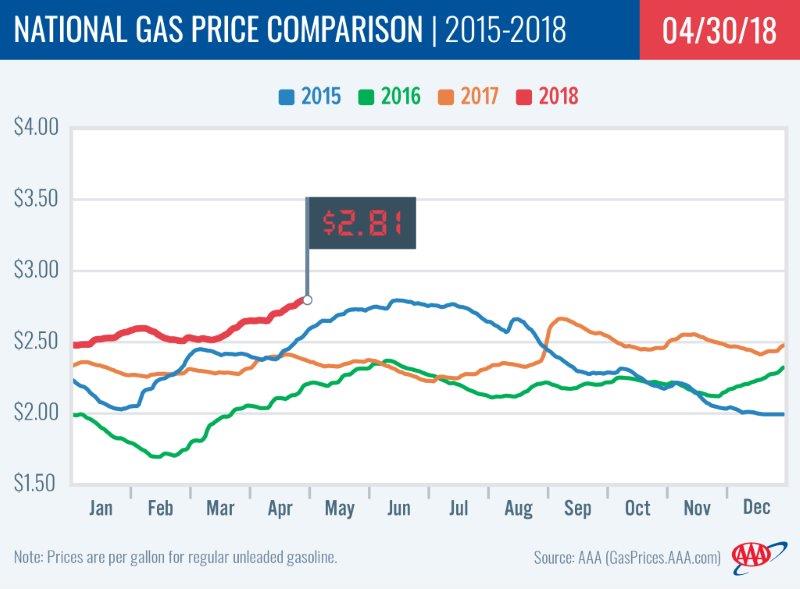
PORTLAND, Ore., – The national and Oregon gas price averages are at their highest levels since the fall of 2014. For the week, the national average for regular rises four cents to $2.81 a gallon, its highest price since October 2014. The Oregon average adds three cents to $3.20, the highest price since November 2014.
“AAA projects pump prices will climb another five to 15 cents through Memorial Day, then stabilize for the summer; however, prices could spike again due to robust demand and/or world events,” says Marie Dodds, public affairs director for AAA Oregon/Idaho. “AAA does not expect the national average to top $3 a gallon this year, barring unforeseen events.”
The week-over-week increases in the price of unleaded gasoline can be largely attributed to gas stations continuing to switchover to the more expensive summer blend of gasoline, which helps reduce excessive evaporation when outside temperatures rise. Gas stations around the country must begin selling summer blend gasoline by June 1 to comply with federal mandates.
Demand for gasoline shows a decline for the week, with a notable drop from its record high the previous week, falling by 774,000 b/d, according to the U.S. Energy Information Administration (EIA). At 9.083 million b/d, gasoline demand is now more in line with rates typically seen during the spring driving season. In March and April, demand for gasoline had approached 10 million b/d, which was more typical of demand during the summer months.
Oregon is one of 48 states and the District of Columbia reporting week-over-week increases. The largest jumps are in Missouri (+9 cents) and Delaware (+7 cents). Oregon has one of the smallest weekly increases of 3 cents, which is the 38th largest in the country. The only two states reporting weekly decreases are Indiana (-1 cent) and Florida (down fractions of a cent).
All 50 states and the District of Columbia have higher prices than one month ago. The national average is 15 cents more and the Oregon average is 11 cents more than a month ago. This is the 42nd largest monthly increase in the country. Utah (+40 cents) and Idaho (+29 cents) have the largest monthly gains.
The West Coast still has the most expensive gas prices in the nation with six of the top ten states in this region. This week California bumps Hawaii out of the top spot into second, followed by Washington, Alaska, Nevada and Oregon. Oregon is sixth most expensive for the third week in a row. This week nine states have averages at or above $3 a gallon, up from eight last week.
For the fifth consecutive week, gasoline stocks in the West Coast region have fallen. At 29.6 million bbl for the week ending on April 20, inventories in the region are at their lowest point since November 2017. Although stocks are below the level they were at last year, they are still higher than the five year average for the region.
The nation’s cheapest markets are Oklahoma ($2.52) and Arkansas ($2.52). For the 39th week in a row, no states have an average below $2.
Drivers in all 50 states and the District of Columbia are paying are paying more than a year ago to fill up. The national average is 43 cents more and the Oregon average is 44 cents more than a year ago. This is the 18th-largest yearly increase in the country. California has the greatest year-over-year increase of 62 cents; Utah is second at 61 cents; Arizona is third at 56 cents; and Hawaii is fourth at 53 cents.
Oil Market Dynamics
Crude oil prices remain near the three-year highs they reached in April but are slightly lower this week amid signs of rising stockpiles and growing U.S. crude production. The EIA report revealed crude inventories moved higher by 2.2 million bbl and total U.S. crude oil output increased to 10.586 million b/d. The big news in U.S. crude production this week is in exports, which surged to 2.331 million b/d last week – the highest weekly estimate ever on record from the EIA. The new record high bested the last record, which was set in mid-February of this year. Records are a direct result of the federal ban on crude exports being lifted in 2015.
Crude production in the U.S. is likely to continue climbing. It has grown considerably alongside the total number of active rigs. According to Baker Hughes, the total number of rigs increased by five last week, bringing the total to 825. There are 128 more rigs this year than last year at this time.
At the close of Friday’s formal trading session on the NYMEX, West Texas Intermediate dropped 9-cents to settle at $68.10. At the close of Monday’s formal trading session on the NYMEX, WTI added 47 cents to settle at $68.57. Today crude is trading around $67, compared to $69 a week ago. Crude prices are up about eight percent in the last month and are about $19 more per barrel than a year ago.
Drivers can find current gas prices along their route with the free AAA Mobile app for iPhone, iPad and Android. The app can also be used to map a route, find discounts, book a hotel and access AAA roadside assistance. Learn more at AAA.com/mobile.
Diesel
For the week, the national average gains three cents to $3.07 a gallon. Oregon’s average adds two cents to $3.31. A year ago the national average for diesel was $2.53 and the Oregon average was $2.70.
Find current fuel prices at GasPrices.AAA.com.
AAA news releases, high resolution images, broadcast-quality video, fact sheets and podcasts are available on the AAA NewsRoom at NewsRoom.AAA.com.