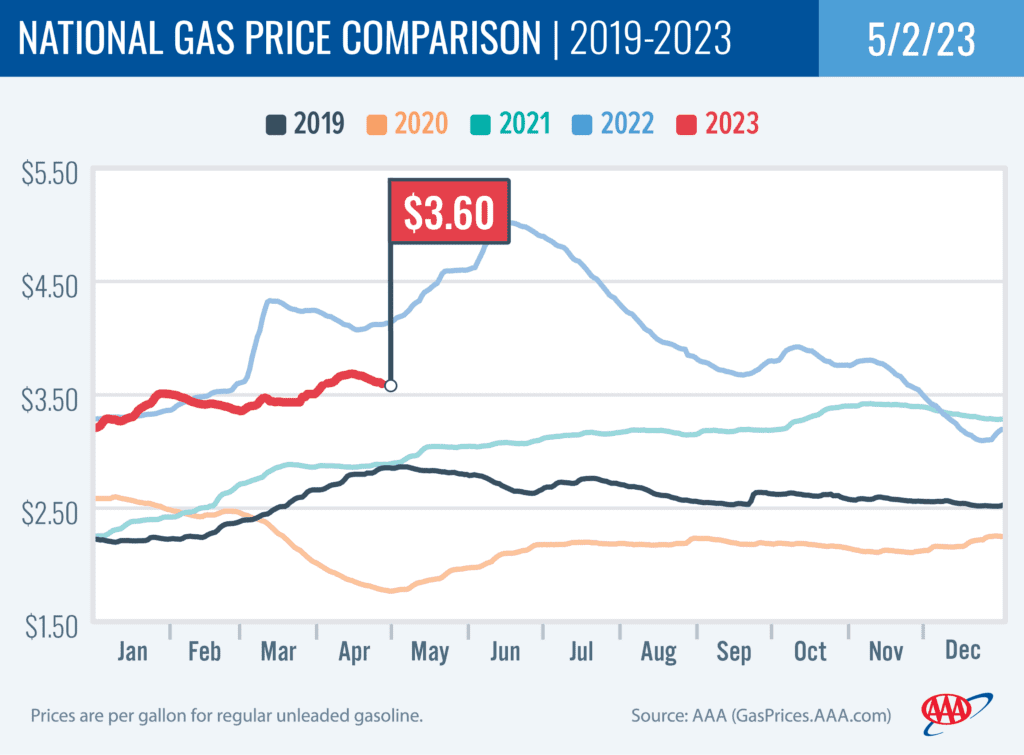
PORTLAND, Ore., – Crude oil prices below $80 per barrel continue to put downward pressure on pump prices. While the national average has been steadily declining for more than a week, prices in most West Coast states continue to rise for now; however, prices in this region are expected to hit their spring peak soon. For the week, the national average for regular loses six cents to $3.60 a gallon. The Oregon average ticks up two cents to $4.12.
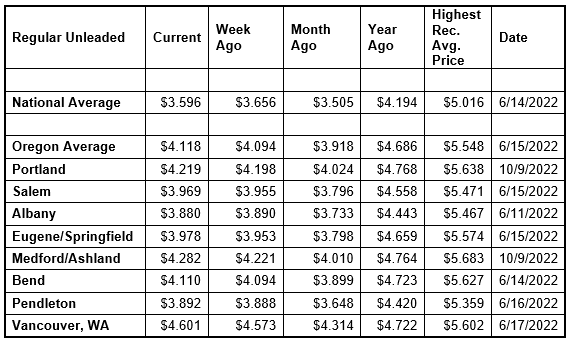
“The national average climbed to nearly $3.69 on April 20 and has fallen steadily since then. The Oregon average has continued to edge up and is at its year-to-date high today of nearly $4.12,” says Marie Dodds, public affairs director for AAA Oregon/Idaho. “Gas prices normally reach their spring peak sometime in May.”
Crude oil prices fell below $80 per barrel on April 19 and have remained in the $70s per barrel since then. Oil prices rose above $80 per barrel after the April 2 announcement from the Organization of the Petroleum Exporting Countries and other major oil producers, including Russia, known collectively as OPEC+, that the cartel would cut oil production by just over 1 million b/d through the end of 2023.
“As long as crude oil prices keep wobbling in the $70s per barrel, we can expect pump prices to settle down, barring other events that disrupt supplies,” adds Dodds.
Crude oil is trading around $72 today compared to $75 a week ago and $105 a year ago. In March, West Texas Intermediate ranged between about $64 and $81 per barrel. In February, WTI ranged between about $73 and $80 per barrel. In January, WTI ranged between about $73 and $82 bbl. Crude reached recent highs of $123.70 on March 8, 2022, shortly after the Russian invasion of Ukraine, and $122.11 per barrel on June 8, 2022. The all-time high for WTI crude oil is $147.27 in July 2008.
Crude oil is the main ingredient in gasoline and diesel, so pump prices are impacted by crude prices on the global markets. On average, about 56% of what we pay for in a gallon of gasoline is for the price of crude oil, 20% is refining, 11% distribution and marketing, and 14% are taxes, according to the U.S. Energy Information Administration.
A factor that always puts upward pressure on pump prices in the spring is the seasonal switch to summer-blend fuel. California has an April 1 deadline to switch to summer-blend fuel, while the federally mandated deadline is May 1. The West Coast region often sees prices climb earlier than other parts of the country because of that earlier California deadline. This fuel is more environmentally friendly but more expensive to produce. More info on summer- and winter-blend gasoline can be found at the EPA website.
U.S. refineries often go off-line or have reduced output ahead of these seasonal switchovers so that maintenance can occur. Refineries continue to return to service from extensive winter/spring maintenance. More refinery operations will be restarted in the next few weeks, with some planned work extending into June.
Demand for gasoline in the U.S. demand increased significantly from 8.52 to 9.51 million b/d for the week ending April 21. The spike in demand surprised market observers, but the estimate could be revised when EIA releases final demand measurements for April. This compares to 8.74 million b/d a year ago. Meanwhile, total domestic gasoline stocks decreased by 2.4 million bbl to 221.1 million bbl. Higher demand, alongside a decline in stocks, would typically push pump prices up; however, fluctuating oil prices have pushed them lower. If oil prices continue to decline, pump prices will likely follow suit.
Quick stats
Oregon is one of 10 states with higher prices now than a week ago. Utah (+10 cents) has the largest weekly jump. All other increases are a nickel or less. Michigan (-12 cents) has the largest weekly drop.
California ($4.86) has the most expensive gas in the nation for the ninth week in a row. Hawaii ($4.78) is second, Arizona ($4.70) is third, Washington ($4.59) is fourth, Nevada ($4.25) is fifth, Oregon ($4.12) is sixth, and Illinois ($4.03) is seventh. These are the seven states with averages at or above $4 a gallon. This week 43 states and the District of Columbia have averages in the $3-range. No states have averages in the $2 range this week, same as a week ago.
The cheapest gas in the nation is in Mississippi ($3.07) and Texas ($3.15). For the 120th week in a row, no state has an average below $2 a gallon.
The difference between the most expensive and least expensive states is $1.79 this week, compared to $1.76 a week ago.
Oregon is one of 43 states and the District of Columbia with higher prices now than a month ago. The national average is nine cents more and the Oregon average is 20 cents more than a month ago. Arizona (+41 cents) has the largest monthly jump. Indiana (-8 cents) has the largest month-over-month decline. The average in Louisiana is flat.
Oregon is one of 49 states and the District of Columbia with lower prices now than a year ago. The national average is 60 cents less and the Oregon average is 57 cents less than a year ago. California (-88 cents) has the largest yearly drop. Arizona (+14 cents) is the only state with a year-over-year increase. A year ago, pump prices were rising rapidly after the start of the Russian invasion of Ukraine.
West Coast
The West Coast region continues to have the most expensive pump prices in the nation with all seven states in the top 10. It’s typical for the West Coast to have six or seven states in the top 10 as this region tends to consistently have fairly tight supplies, consuming about as much gasoline as is produced. In addition, this region is located relatively far from parts of the country where oil drilling, production and refining occurs, so transportation costs are higher. And environmental programs in this region add to the cost of production, storage and distribution.
| Rank | Region | Price on 5/2/23 | ||
| 1 | California | $4.86 | ||
| 2 | Hawaii | $4.78 | ||
| 3 | Arizona | $4.70 | ||
| 4 | Washington | $4.59 | ||
| 5 | Nevada | $4.25 | ||
| 6 | Oregon | $4.12 | ||
| 7 | Illinois | $4.03 | ||
| 8 | Alaska | $3.98 | ||
| 9 | Utah | $3.87 | ||
| 10 | Idaho | $3.74 |
As mentioned above, California has the most expensive gas in the nation for the ninth week in a row. Hawaii Arizona, Washington, Nevada, and Oregon round out the top six. Alaska is eighth. Oregon is sixth for the second week in a row.
States in the West Coast region are seeing small changes on the week. California (-3 cents) and Nevada (-2 cents) have week-over-week declines. Oregon (+2 cents), Washington (+1 cent), Alaska (+1 cent), Arizona (+1/2 cent), and Hawaii (+4/10ths of a cent) have weekly increases.
The refinery utilization rate on the West Coast rose from 82.0% to 86.6% for the week ending April 21. This rate has ranged between about 73% to 93% in the last year. The latest national refinery utilization rate is 91.3%.
According to EIA’s latest weekly report, total gas stocks in the region increased from 31.41 million bbl. to 31.46 million bbl.
A higher refinery utilization rate and an increase in gasoline stocks can put downward pressure on pump prices.
Oil market dynamics
Crude oil prices fell to start this week on concerns of higher interest rates in the U.S. and weaker than expected manufacturing data out of China, suggesting that the largest importer of crude oil and nation with the world’s second-largest economy may not rebound quickly from the pandemic. Crude oil prices rose to end last week but fell earlier in the week amid ongoing market concerns that low consumer confidence could contribute to a recession this year. If a recession occurs, oil demand and prices will likely decline. Additionally, the EIA reported that total domestic commercial crude inventories decreased by 5.1 million bbl to 460.9 million bbl last week.
At the close of Friday’s formal trading session, WTI jumped $2.02 to settle at $76.78. At the close of Monday’s formal trading session, WTI fell $1.12 cents to close at $75.66. Today crude is trading around $72, compared to $75 a week ago. Crude prices are about $29 less than a year ago.
Drivers can find current gas prices along their route with the free AAA Mobile app for iPhone, iPad and Android. The app can also be used to map a route, find discounts, book a hotel and access AAA roadside assistance. Learn more at AAA.com/mobile.
Diesel
For the week, the national average loses six cents to $4.11 a gallon. The record high is $5.816 set on June 19, 2022. The Oregon average dips two cents to $4.55. The record high is $6.47 set on July 3, 2022. A year ago the national average for diesel was $5.32 and the Oregon average was $5.45.
Find current fuel prices at GasPrices.AAA.com.
AAA news releases, high resolution images, broadcast-quality video, fact sheets and podcasts are available on the AAA NewsRoom at NewsRoom.AAA.com.
Find local news releases at https://oregon.aaa.com/community/media/media-contacts.html
Fuel prices are updated daily at AAA’s Daily Fuel Gauge at AAA Gas Prices. For more info go www.AAA.com. AAA Oregon/Idaho provides more than 875,000 members with travel, insurance, financial and automotive-related services, and is an affiliate of AAA National, serving more than 63 million motorists in North America.