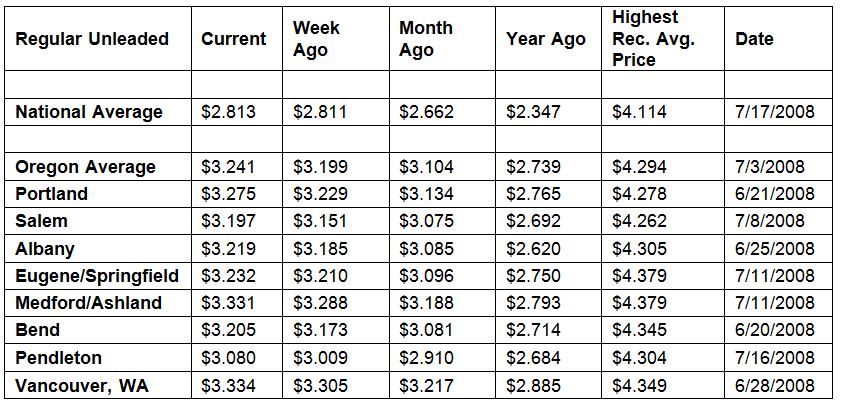
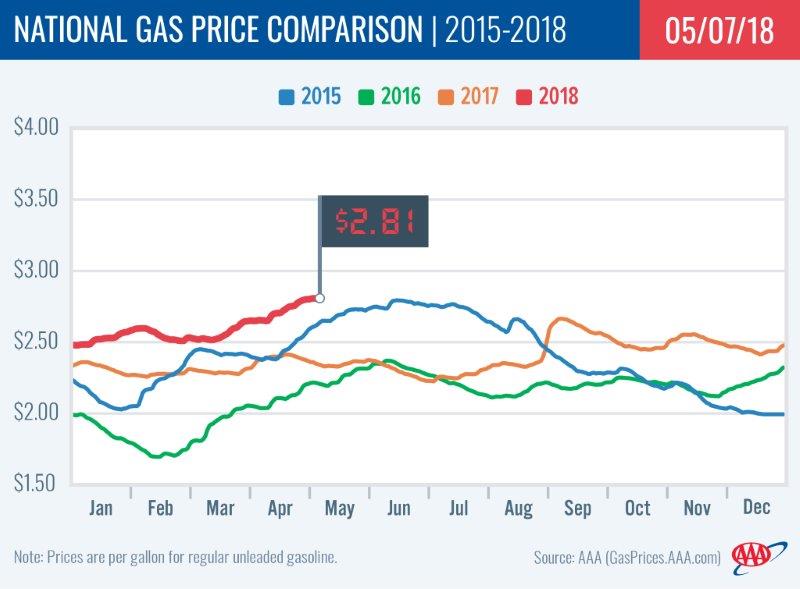
PORTLAND, Ore., – The national and Oregon gas price averages are at their highest levels since the fall of 2014. For the week, the national average for regular holds steady at $2.81 a gallon. The Oregon average jumps four cents to $3.24. Both averages are at their highest prices since October 2014.
“The fast rate at which gas prices were rising may be moderating. This week the national average held steady and 12 states remained flat or saw decreases. AAA says pump prices could jump another dime through Memorial Day then be fairly steady for the summer months, barring unforeseen events,” says Marie Dodds, public affairs director for AAA Oregon/Idaho.
One wildcard is if the U.S. pulls out of the Iran nuclear deal. This could send pump prices higher because it would make it more difficult for Iran to sell its oil on the global markets, creating tighter international oil markets. It could also increase tensions in the Middle East, possibly leading to supply disruptions. This week crude oil prices climbed above $70 a barrel for the first time in four years on reports that President Trump would likely decline to recertify the Iran nuclear deal.
Oregon is one of 38 states and the District of Columbia reporting week-over-week increases. The largest jumps are in Wyoming (+6 cents) and Indiana (+5 cents). Oregon has one of the largest weekly increases of four cents, which is the fourth largest in the country. Michigan has the largest weekly decrease of nine cents.
All 50 states and the District of Columbia have higher prices than one month ago. The national average is 15 cents more and the Oregon average is 14 cents more than a month ago. This is the 32nd largest monthly increase in the country. Utah (+31 cents) and Connecticut (+24 cents) have the largest monthly gains.
The West Coast still has the most expensive gas prices in the nation with six of the top ten states in this region. California is most expensive for the second week in a row, followed by Hawaii, Washington, Alaska, Nevada and Oregon. Oregon is sixth most expensive for the fourth week in a row. This week nine states have averages at or above $3 a gallon, same as last week.
After a steady decline over the past month, gasoline stocks in the region grew during the week ending on April 27, according to the Energy Information Administration (EIA). At 30.5 million bbl, stocks grew by approximately 1 million bbl. Storage levels are now roughly 500,000 bbl more than the same time last year.
The nation’s cheapest markets are Arkansas ($2.54) and Oklahoma ($2.54). For the 40th week in a row, no states have an average below $2.
Drivers in all 50 states and the District of Columbia are paying are paying more than a year ago to fill up. The national average is 47 cents more and the Oregon average is 50 cents more than a year ago. This is the 11th-largest yearly increase in the country. California has the greatest year-over-year increase of 66 cents; Indiana is second at 65 cents; Utah is third at 65 cents; and Arizona is fourth at 61 cents.
Oil Market Dynamics
Crude oil prices climbed above $70 per barrel this week for the first time in four years but are lower today. Oil prices ticked up higher last week following reports that President Trump will potentially decline to recertify the Iran nuclear deal on May 12 and may impose new sanctions on the country. Iranian Foreign Minister Mohammad Javad Zarif responded that the country is unwilling to renegotiate the deal it set with the U.S. in 2015 under the Obama Administration. The decision to not recertify the deal could increase tensions in the volatile region, leading to global supply disruptions. Crude prices are likely to continue climbing as the May 12 deadline for the recertifying draws near and it becomes increasingly likely that the U.S. will decline to renew it.
Additionally, EIA’s weekly petroleum status report noted that U.S. crude production hit another record high at 10.62 million b/d. The growth in production occurred alongside growth in crude inventories, which grew by 6.2 million bbl last week. At 436 million bbl, inventories are nearly 92 million bbl lower than they were at this time last year.
Domestic crude production will likely see continued growth through 2018 – supported by a steady increase in active oil rigs. Baker Hughes, Inc. reported that last week, the U.S. added nine rigs, placing the total at 834. The total rig count is now 131 more than the figure at the same time last year.
At the close of Friday’s formal trading session on the NYMEX, WTI increased $1.29 cents to settle at $69.72 – a new high for the year. At the close of Monday’s formal trading session on the NYMEX, WTI added $1.01 to settle at $70.73, the highest price since November 2014. Today crude is trading around $69, compared to $67 a week ago. Crude prices are up about nine percent in the last month and are about $24 more per barrel than a year ago.
Drivers can find current gas prices along their route with the free AAA Mobile app for iPhone, iPad and Android. The app can also be used to map a route, find discounts, book a hotel and access AAA roadside assistance. Learn more at AAA.com/mobile.
Diesel
For the week, the national average gains a penny to $3.08 a gallon. Oregon’s average adds three cents to $3.34. A year ago the national average for diesel was $2.51 and the Oregon average was $2.67.
Find current fuel prices at GasPrices.AAA.com.
AAA news releases, high resolution images, broadcast-quality video, fact sheets and podcasts are available on the AAA NewsRoom at NewsRoom.AAA.com.