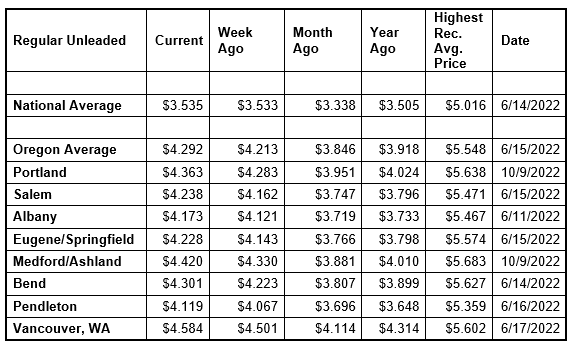
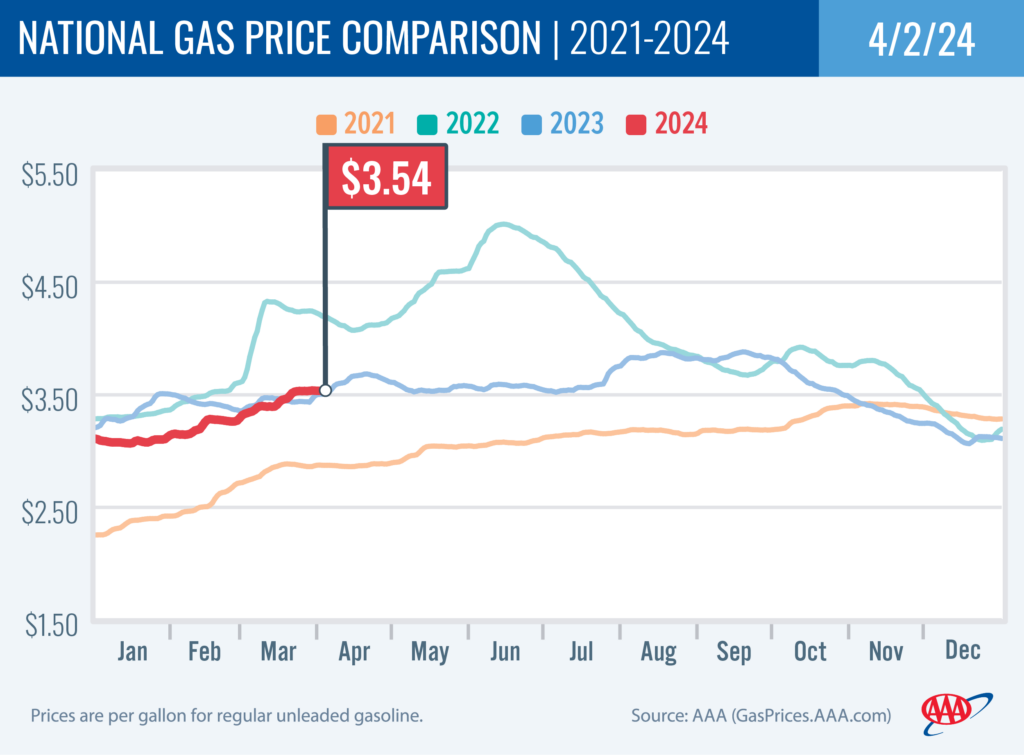
PORTLAND, Ore., – While the national average for regular has seen its increases stall, prices continue to climb in Oregon and the West Coast, in part due to a drop in gasoline stocks in the region. About half of all states, including Oregon, are seeing higher pump prices this week, while prices in the rest of the states are easing. For the week, the national average for regular holds steady at $3.54. The Oregon average rises eight cents to $4.29 a gallon. This is the eighth-largest weekly jump for a state in the nation.
The national average is at its highest price since October. The Oregon average is at its highest price since November.
Only two Oregon counties still have averages below $4 a gallon:
Baker $3.85
Malheur $3.84
The Oregon average began 2024 at $3.79 a gallon compared to $4.29 today. Its lowest price so far this year is $3.58 on February 14 and it has been steadily climbing since then. The national average started the year at $3.11 and is at $3.54 today. Its lowest price so far this year is just under $3.07 on January 15.
“The increase in gas prices during the late winter and through the spring is due to seasonal factors of refinery maintenance, the switch to summer-blend fuel and the increase in demand for gas as people get out and about more as the weather improves and the days get longer. says Marie Dodds, public affairs director for AAA Oregon/Idaho. “Crude oil prices have also climbed to five-month highs, remaining above $80 per barrel since mid-March, and this puts additional upward pressure on pump prices.”
Gas prices always rise this time of year as refineries undergo maintenance as the switch to summer-blend fuel occurs. The switch occurs first in California, which is why pump prices on the West Coast often rise before other parts of the country. The East Coast is the last major market to switch to summer-blend fuel.
Crude oil prices have remained elevated due to geopolitical events around the world including drone attacks on Russian refineries, Houthi militant attacks in the Red Sea, and the conflict between Israel and Hamas. In addition, markets believe that that global demand for crude oil will increase this year which has kept crude oil prices elevated against the backdrop of production cuts by OPEC+.
Crude oil prices are at their highest since October. West Texas Intermediate climbed above $80 on March 14 and has remained above that benchmark since then. A major driver is the Ukrainian attacks on Russian refineries. Russia is a top global oil producer and the refinery attacks have tightened global supplies.
Crude prices were volatile after the attack on Israel by Hamas in October. While Israel and the Palestinian territory are not oil producers, there’ve been concerns that the conflict could spread in the Middle East, which could potentially impact crude production in other oil-producing nations in the region.
Crude oil is trading around $85 today compared to $82 a week ago and $80 a year ago. In 2023, West Texas Intermediate ranged between $63 and $95 per barrel. Crude reached recent highs of $123.70 on March 8, 2022, shortly after the Russian invasion of Ukraine, and $122.11 per barrel on June 8, 2022. The all-time high for WTI crude oil is $147.27 in July 2008.
Crude oil is the main ingredient in gasoline and diesel, so pump prices are impacted by crude prices on the global markets. On average, about 57% of what we pay for in a gallon of gasoline is for the price of crude oil, 14% is refining, 13% distribution and marketing, and 16% are taxes, according to the U.S. Energy Information Administration.
Demand for gas in the U.S. decreased slightly from 8.81 to 8.72 million b/d for the week ending March 22, according to the U.S. Energy Information Administration (EIA). This compares to 9.15 million b/d at the same time last year. Meanwhile, total domestic gasoline stocks increased by 1.3 million bbl to 232.1 million bbl. Lower demand would typically contribute to pushing pump prices lower or slowing increases, but rising oil prices have kept them elevated instead.
Quick stats
Oregon is one of 23 states and the District of Columbia with higher prices now than a week ago. Alaska (+15 cents) has the largest week-over-week gain in the nation. Oregon has the eighth-largest increase. Delaware (-8 cents) has the biggest weekly decline.
California ($5.12) has the most expensive gas in the nation for the fifth week in a row and is the only state in the nation with an average at or above $5 per gallon. Hawaii ($4.69) is second, Washington ($4.54) is third, Nevada ($4.46) is fourth, Oregon ($4.29) is fifth, and Alaska ($4.15) is sixth. These are the six states with averages at or above $4, same as a week ago. This week 44 states and the District of Columbia have averages in the $3-range. No states have averages in the $2 range this week.
The cheapest gas in the nation is in Mississippi ($3.07) and Colorado ($3.07). No state has had an average below $2 a gallon since January 7, 2021, when Mississippi and Texas were below that threshold.
The difference between the most expensive and least expensive states is $2.05 this week, compared to $1.93 a week ago.
Oregon is one of 48 states and the District of Columbia with higher prices now than a month ago. The national average is 20 cents more and the Oregon average is 45 cents more than a month ago. This is the fourth-largest monthly gain in the nation. Indiana (-3 cents) and Hawaii (-1 cent) are the only states with monthly decreases.
Oregon is one of 34 states and the District of Columbia with higher prices now than a year ago. The national average is three cents more and the Oregon average is 37 cents more than a year ago. This is the second-largest yearly gain in the nation. Arizona (-49 cents) has the largest yearly decrease. Montana (+38 cents) has the largest year-over-year increase.
West Coast
The West Coast region continues to have the most expensive pump prices in the nation with all seven states in the top 10. It’s typical for the West Coast to have six or seven states in the top 10 as this region tends to consistently have fairly tight supplies, consuming about as much gasoline as is produced. In addition, this region is located relatively far from parts of the country where oil drilling, production and refining occurs, so transportation costs are higher. And environmental programs in this region add to the cost of production, storage and distribution.
| Rank | Region | Price on 4/2/2024 |
| 1 | California | $5.12 |
| 2 | Hawaii | $4.69 |
| 3 | Washington | $4.54 |
| 4 | Nevada | $4.46 |
| 5 | Oregon | $4.29 |
| 6 | Alaska | $4.15 |
| 7 | Illinois | $3.88 |
| 8 | Utah | $3.83 |
| 9 | Arizona | $3.81 |
| 10 | Idaho | $3.72 |
As mentioned above, California has the most expensive gas in the country for the fifth week in a row. Hawaii, Washington, Nevada, Oregon, and Alaska round out the top six. Arizona is ninth. Oregon is fifth most expensive for the 24th week in a row.
Six of the seven states in the West Coast region are seeing week-over-week increases: Alaska (+15 cents) has the largest jump in the region and the nation. California (+12 cents), Nevada (+12 cents), Washington (+9 cents), Oregon (+8 cents), Arizona (+6 cents) also have weekly increases. Hawaii (-1/2 cent) is the only state in the region with a week-over-week decline.
The refinery utilization rate on the West Coast rose from 82.4% to 84.5% for the week ending March 22. This rate has ranged between about 74% to 97% in the last year. The latest national refinery utilization rate increased from 87.8% to 88.7%. The refinery utilization rate measures how much crude oil refineries are processing as a percentage of their maximum capacity. A low or declining rate can put upward pressure on pump prices.
According to EIA’s latest weekly report, total gas stocks in the region fell from 30.48 million bbl. to 29.49 million bbl.
An increase in the refinery utilization rate can put downward pressure on pump prices; however, a lower percentage can put upward pressure on prices. A decrease in gasoline stocks can put upward pressure on pump prices.
Oil market dynamics
Crude oil prices climbed this week to their highest level since last October due to supply concerns from the Ukrainian drone strikes on Russian oil refineries and escalating conflict in the Middle East. Last week, crude prices fell after the EIA reported that total domestic commercial crude stocks increased by 3.2 million bbl to 448.2 million bbl last week. Although stocks increased when compared to a year ago, the current stock level is 25.5 million bbl lower than at the end of March 2023.
At the close of last Thursday’s formal trading session, WTI lost $1.82 to settle at $83.17. U.S. markets were closed on Friday in observance of Good Friday. At the close of Monday’s formal trading session, WTI added 54 cents to close at $83.71. Today crude is trading around $85 compared to $82 a week ago. Crude prices are about $8 more than a year ago.
Drivers can find current gas prices along their route with the free AAA Mobile app for iPhone, iPad and Android. The app can also be used to map a route, find discounts, book a hotel and access AAA roadside assistance. Learn more at AAA.com/mobile.
Diesel
For the week, the national average slips three cents to $4.02 a gallon. The record high is $5.816 set on June 19, 2022. The Oregon average adds three cents to $4.24. The record high is $6.47 set on July 3, 2022. A year ago the national average for diesel was $4.22 and the Oregon average was $4.65.
Find current fuel prices at GasPrices.AAA.com.
AAA news releases, high resolution images, broadcast-quality video, fact sheets and podcasts are available on the AAA NewsRoom at NewsRoom.AAA.com.
Find local news releases at https://oregon.aaa.com/community/media/media-contacts.html
Fuel prices are updated daily at AAA’s Daily Fuel Gauge at AAA Gas Prices. For more info go www.AAA.com. AAA Oregon/Idaho provides more than 890,000 members with travel, insurance, financial and automotive-related services, and is an affiliate of AAA National, serving more than 64 million motorists in North America.