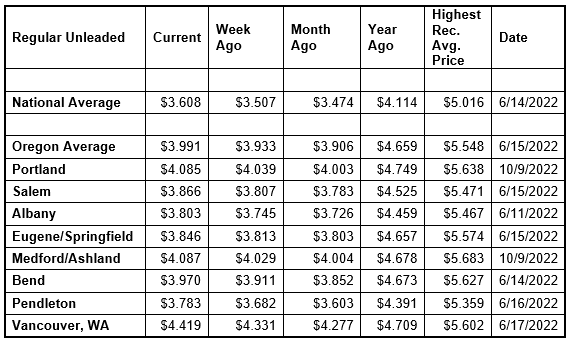
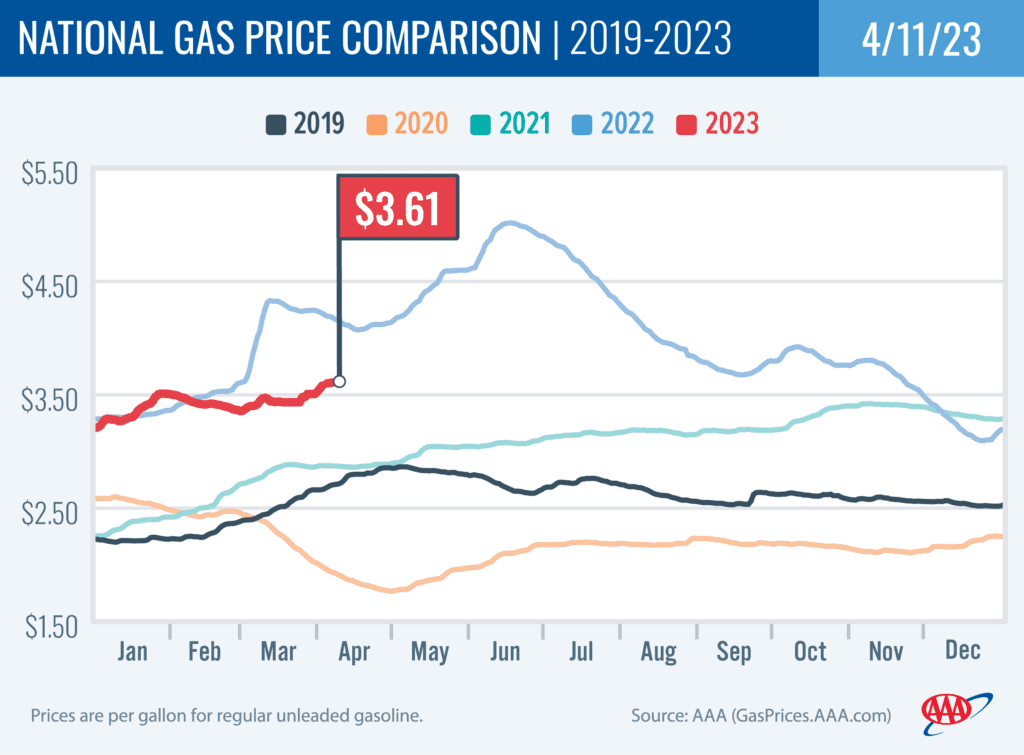
PORTLAND, Ore., – The unexpected announcement from OPEC+ that it would cut oil production starting in May has helped push gas prices higher. Other factors behind climbing pump prices include an increase in demand for gas in the U.S. and a drop in gasoline stocks. For the week, the national average for regular unleaded jumps a dime to $3.61 a gallon. The Oregon average gains six cents to $3.99.
“Oil markets have had more than a week to digest the news from OPEC+. The announcement sent crude oil prices surging above $80 a barrel, although prices have struggled to stay above that mark,” says Marie Dodds, public affairs director for AAA Oregon/Idaho. “Still, the cost of oil accounts for more than 50% of what we pay at the pump, so drivers may not catch a break at the pump any time soon.”
On Sunday, April 2, the Organization of the Petroleum Exporting Countries and other major oil producers, including Russia, known collectively as OPEC+, announced a voluntary agreement to slash their output by just over 1 million b/d through the end of 2023. The cut is planned to start in early May. The move caused oil prices to spike, popping over the $80 per barrel mark. This puts upward pressure on pump prices when they were already rising due to the switch to summer-blend fuel and higher demand during the summer driving season.
Crude oil prices shot up above $80 per barrel on Monday, April 3 and remained above $80 last week. These were the highest closing prices since March 6. Crude oil continues to trade around $81 today compared to $81 a week ago and $94 a year ago. In March, West Texas Intermediate ranged between about $64 and $81 per barrel. In February, WTI ranged between about $73 and $80 per barrel. In January, WTI ranged between about $73 and $82 bbl. Crude reached recent highs of $123.70 on March 8, 2022, shortly after the Russian invasion of Ukraine, and $122.11 per barrel on June 8, 2022. The all-time high for WTI crude oil is $147.27 in July 2008.
Crude oil is the main ingredient in gasoline and diesel, so pump prices are impacted by crude prices on the global markets. On average, about 56% of what we pay for in a gallon of gasoline is for the price of crude oil, 20% is refining, 11% distribution and marketing, and 14% are taxes, according to the U.S. Energy Information Administration.
Another factor putting upward pressure on pump prices this time of year is the seasonal switch to summer-blend fuel. California has an April 1 deadline to switch to summer-blend fuel, while the federally mandated deadline is May 1. The West Coast region often sees prices climb earlier than other parts of the country because of that earlier California deadline. More info on summer- and winter-blend gasoline can be found at the EPA website.
Demand for gasoline in the U.S. demand increased slightly from 9.15 to 9.3 million b/d for the week ending March 31. This compares to 8.56 million b/d a year ago. Meanwhile, total domestic gasoline stocks decreased substantially by 4.1 million bbl to 222.6 million bbl. Increased demand amid tighter supply has contributed to pushing pump prices higher. If demand continues to rise, pump prices will likely follow suit.
Quick stats
Oregon is one of 47 states and the District of Columbia with higher prices now than a week ago. Ohio (+24 cents) has the largest weekly jump. Utah (-3 cents) has the largest week-over-week decline. The average in Idaho is flat.
California ($4.89) has the most expensive gas in the nation for the sixth week in a row. Hawaii ($4.78) is second, Arizona ($4.42) is third, Washington ($4.40) is fourth, and Nevada ($4.24) is fifth. These are the only five states with averages at or above $4 a gallon. This week 45 states and the District of Columbia have averages in the $3-range. No states have averages in the $2 range this week, same as a week ago.
The cheapest gas in the nation is in Mississippi ($3.14) and Arkansas ($3.19). For the 117th week in a row, no state has an average below $2 a gallon.
The difference between the most expensive and least expensive states is $1.75 this week, compared to $1.82 a week ago.
Oregon is one of 41 states and the District of Columbia with higher prices now than a month ago. The national average is 13 cents more and the Oregon average is nine cents more than a month ago. Arizona (+47 cents) has the largest monthly jump. Colorado (-42 cents) has the largest monthly decline. The averages in Alaska and Maine are flat month-over-month.
All 50 states and the District of Columbia have lower prices now than a year ago. The national average is 51 cents less and the Oregon average is 67 cents less than a year ago. California (-88 cents) has the largest yearly drop. Arizona (-19 cents) has the smallest. A year ago, pump prices were rising rapidly after the start of the Russian invasion of Ukraine.
West Coast
The West Coast region continues to have the most expensive pump prices in the nation with all seven states in the top 10. It’s typical for the West Coast to have six or seven states in the top 10 as this region tends to consistently have fairly tight supplies, consuming about as much gasoline as is produced. In addition, this region is located relatively far from parts of the country where oil drilling, production and refining occurs, so transportation costs are higher. And environmental programs in this region add to the cost of production, storage and distribution.
As mentioned above, California has the most expensive gas in the nation for the sixth week in a row. Hawaii Arizona, Washington, Nevada, and Oregon round out the top six. Alaska is eighth. Oregon is sixth for the ninth week in a row.
| Rank | Region | Price on 4/11/23 | ||
| 1 | California | $4.89 | ||
| 2 | Hawaii | $4.78 | ||
| 3 | Arizona | $4.42 | ||
| 4 | Washington | $4.40 | ||
| 5 | Nevada | $4.24 | ||
| 6 | Oregon | $3.99 | ||
| 7 | Illinois | $3.98 | ||
| 8 | Alaska | $3.85 | ||
| 9 | Pennsylvania | $3.70 | ||
| 10 | District of Columbia | $3.70 |
All states in the West Coast region are seeing small to moderate changes on the week. Arizona (+11 cents) has the largest increase in the region. Nevada (+1 cent) has the smallest weekly increase in the region. Hawaii (-1 cent) is the only state in the region with a weekly decline.
The refinery utilization rate on the West Coast fell from 86.0% to 82.7% for the week ending March 31. This rate has ranged between about 73% to 93% in the last year. The latest national refinery utilization rate is 90.3%.
According to EIA’s latest weekly report, total gas stocks in the region decreased from 30.12 million bbl. to 29.99 million bbl.
A lower refinery utilization rate and a decrease in gasoline stocks can put upward pressure on pump prices.
Oil market dynamics
Crude prices have remained between about $79 and $81 per barrel over the last week. Crude prices declined slightly to start this week on market concerns that a recession could occur this year, which could push oil demand and prices down. Last week, crude prices spiked after the Organization of Petroleum Exporting Countries and its allies, including Russia, collectively known as OPEC+, announced it would cut production by 1.6 million bbl starting next month for the remainder of 2023. Additionally, the EIA reported that total domestic commercial crude inventories decreased by 3.7 million bbl to 470 million bbl last week.
U.S. markets were closed Friday in observance of Good Friday. At the close of Monday’s formal trading session, WTI fell 96 cents to close at $79.74. Today crude is trading around $81, compared to $81 a week ago. Crude prices are about $19 less than a year ago.
Drivers can find current gas prices along their route with the free AAA Mobile app for iPhone, iPad and Android. The app can also be used to map a route, find discounts, book a hotel and access AAA roadside assistance. Learn more at AAA.com/mobile.
Diesel
For the week, the national average dips a penny to $4.20 a gallon. The record high is $5.816 set on June 19, 2022. The Oregon average slips two cents to $4.61. The record high is $6.47 set on July 3, 2022. A year ago the national average for diesel was $5.04 and the Oregon average was $5.39.
Find current fuel prices at GasPrices.AAA.com.
AAA news releases, high resolution images, broadcast-quality video, fact sheets and podcasts are available on the AAA NewsRoom at NewsRoom.AAA.com.
Find local news releases at https://oregon.aaa.com/community/media/media-contacts.html
Fuel prices are updated daily at AAA’s Daily Fuel Gauge at AAA Gas Prices. For more info go www.AAA.com. AAA Oregon/Idaho provides more than 875,000 members with travel, insurance, financial and automotive-related services, and is an affiliate of AAA National, serving more than 63 million motorists in North America.