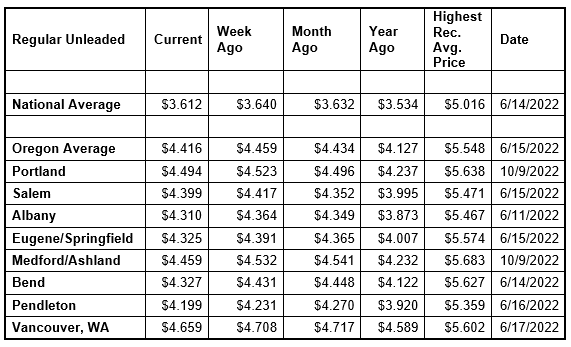
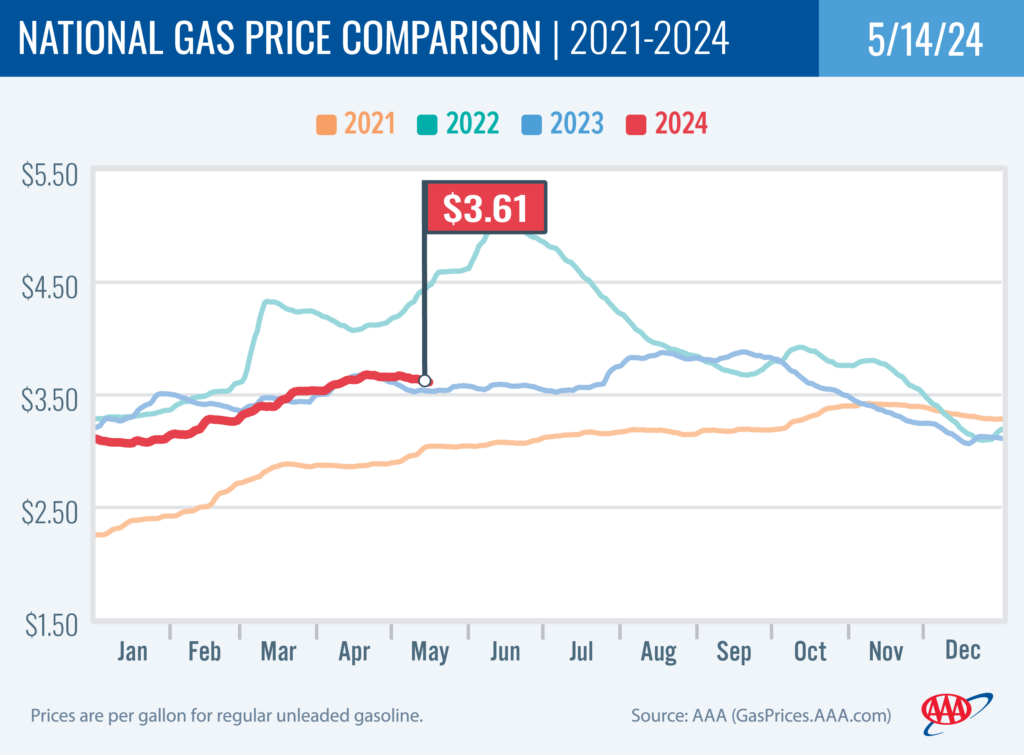
PORTLAND, Ore., – Gas prices continue to drift lower in most states, including Oregon. The major drivers are crude oil prices below $80 a barrel, as well as tepid demand for gas and rising supplies in the U.S. For the week, the national average for regular dips three cents to $3.61. The Oregon average falls four cents to $4.42 a gallon.
“Pump prices should continue to move lower between now and Memorial Day, barring unforeseen events. Refinery maintenance season is by and large over, and refineries are cranking out products such as gasoline, diesel and jet fuel,” says Marie Dodds, public affairs director for AAA Oregon/Idaho. “However, crude oil prices remain the major wildcard and could easily move up again, depending on what happens in the Middle East and in the war between Russia and Ukraine.”
AAA says Memorial Day travel will be the second-busiest on record. AAA projects 43.8 million Americans million people (13%) of the population) will travel 50 miles or more from home this Memorial Day weekend. This is an increase of 4% over 2023 and just shy of matching the record of 44 million travelers in 2005.
About 600,000 Oregonians will travel over the long weekend.
Find all the details, graphics, top destinations, best and worst times to drive, and advice for travelers in the AAA Memorial Day travel news release.
The national and Oregon averages are at the same prices as they were in mid-April.
The Oregon average began 2024 at $3.79 a gallon compared to $4.42 today. Its lowest price so far this year is $3.58 on February 14 and the highest is nearly $4.51 on May 1. The national average started the year at $3.11 and is at $3.61 today. Its lowest price so far this year is just under $3.07 on January 15 and the highest is just under $3.68 on April 19.
Gas prices always rise starting in late winter through the spring as refineries undergo maintenance as the switch to summer-blend fuel occurs. The switch occurs first in California, which is why pump prices on the West Coast often rise before other parts of the country. The East Coast is the last major market to make the change to summer-blend fuel. Most areas have a May 1 compliance date for refiners and terminals, while most gas stations have a June 1 deadline to switch to selling summer-blend until June 1. Switch-over dates are earlier in California with some areas in the state requiring summer-blend fuel by April 1. Some refineries will begin maintenance and the switchover as early as February.
Crude oil prices have remained elevated and volatile due to geopolitical events around the world including increased volatility in the Middle East, the war between Russia and Ukraine, and Houthi militant attacks in the Red Sea. In addition, production cuts by OPEC+ have tightened global crude oil supplies.
The price of crude oil reached the year-to-date high of nearly $87 per barrel on April 5 and has moved lower since then. West Texas Intermediate climbed above $80 on March 14 and above $85 on April 2, then dipped below $85 starting on April 17 and below $80 again on May 1. Major drivers of elevated crude prices are the unrest in the Middle East and the Ukrainian attacks on Russian refineries. Russia is a top global oil producer and the refinery attacks have reduced output.
Crude prices have been volatile after the attack on Israel by Hamas in October. While Israel and the Palestinian territory are not oil producers, concerns remain that the conflict could spread in the Middle East, which could potentially impact crude production in other oil-producing nations in the region.
Crude oil is trading around $78 today compared to $78 a week ago and $70 a year ago. In 2023, West Texas Intermediate ranged between $63 and $95 per barrel. Crude reached recent highs of $123.70 on March 8, 2022, shortly after the Russian invasion of Ukraine, and $122.11 per barrel on June 8, 2022. The all-time high for WTI crude oil is $147.27 in July 2008.
Crude oil is the main ingredient in gasoline and diesel, so pump prices are impacted by crude prices on the global markets. On average, about 56% of what we pay for in a gallon of gasoline is for the price of crude oil, 19% is refining, 10% distribution and marketing, and 15% are taxes, according to the U.S. Energy Information Administration.
Demand for gasoline in the U.S. remains tepid and is in the pre-Memorial Day doldrums. Demand for gas in the U.S. rose modestly from 8.62 million b/d to 8.79 for the week ending May 3, according to the U.S. Energy Information Administration (EIA). This compares to 9.30 million b/d a year ago. Meanwhile, total domestic gasoline stocks increased by nearly 1 million bbl to 228 million bbl.
Slack demand, rising supply, and falling oil prices could push pump prices lower.
Quick stats
Oregon is one of 43 states and the District of Columbia with lower prices now than a week ago. Ohio (+14 cents) has the biggest weekly increase. Nevada (-9 cents) has the largest week-over-week decline in the nation.
California ($5.27) has the most expensive gas in the nation for the 11th week in a row and remains the only state in the nation with an average at or above $5 per gallon. Hawaii ($4.81) is second, Washington ($4.64) is third, Nevada ($4.43) is fourth, Oregon ($4.42) is fifth, and Alaska ($4.38) is sixth. These are the six states with averages at or above $4 a gallon, down from seven states a week ago. This week, Arizona ($3.94) has dipped below the $4 mark. This week 44 states and the District of Columbia have averages in the $3-range. No states have averages in the $2 range this week.
The cheapest gas in the nation is in Mississippi ($3.08) and Oklahoma ($3.13) and. No state has had an average below $2 a gallon since January 7, 2021, when Mississippi and Texas were below that threshold.
The difference between the most expensive and least expensive states is $2.20 this week, compared to $2.23 a week ago.
Oregon is one of 34 states and the District of Columbia with lower prices now than a month ago. The national average is two cents less and the Oregon average is also two cents less than a month ago. Rhode Island (+23 cents) has the largest monthly jump. Nevada (-21 cents) has the biggest monthly decline.
Oregon is one of 34 states and the District of Columbia with higher prices now than a year ago. The national average is eight cents more than a year ago and the Oregon average is 29 cents more than a year ago. This is the third-largest yearly gain in the nation. California (+47 cents) has the largest year-over-year increase. Arizona (-73 cents) has the largest yearly decrease.
West Coast
The West Coast region continues to have the most expensive pump prices in the nation with all seven states in the top 10. It’s typical for the West Coast to have six or seven states in the top 10 as this region tends to consistently have fairly tight supplies, consuming about as much gasoline as is produced. In addition, this region is located relatively far from parts of the country where oil drilling, production and refining occurs, so transportation costs are higher. And environmental programs in this region add to the cost of production, storage and distribution.
| Rank | Region | Price on 5/14/2024 |
| 1 | California | $5.27 |
| 2 | Hawaii | $4.81 |
| 3 | Washington | $4.64 |
| 4 | Nevada | $4.43 |
| 5 | Oregon | $4.42 |
| 6 | Alaska | $4.38 |
| 7 | Arizona | $3.94 |
| 8 | Illinois | $3.90 |
| 9 | Idaho | $3.85 |
| 10 | Pennsylvania | $3.76 |
As mentioned above, California has the most expensive gas in the country for the 11th week in a row. Hawaii, Washington, Nevada, Oregon, Alaska and Arizona round out the top seven. Oregon is fifth most expensive for the 30th week in a row.
States in the West Coast region are seeing small to moderate week-over-week changes. Nevada (-9 cents), Arizona (-7 cents), California (-7 cents), Oregon (-4 cents), Washington (-3 cents), and Hawaii (-1 cent) have declines. Alaska is the only state in the region with a weekly increase and it is only one-tenth of a cent.
The refinery utilization rate on the West Coast increased slightly from 84.2% to 84.7% for the week ending May 3. This rate has ranged between about 74% to 97% in the last year. The latest national refinery utilization rate increased from 87.5% to 88.5%. The refinery utilization rate measures how much crude oil refineries are processing as a percentage of their maximum capacity. A low or declining rate can put upward pressure on pump prices.
According to EIA’s latest weekly report, total gas stocks in the region rose from 28.44 million bbl. to 29.00 million bbl.
An increase in the refinery utilization rate and/or a high rate can put downward pressure on pump prices, and an increase in gasoline stocks can also put downward pressure on pump prices.
Oil market dynamics
Crude oil prices ended last week with a small increase as the EIA reported that crude oil inventories had decreased by 1.4 million barrels from the previous week. At 459.5 million barrels, U.S. crude oil inventories are about 3% below the five-year average for this time of year. Crude prices are up slightly to start this week as market watchers weigh expectations that OPEC+ will extend its oil production cuts into the second half of the year.
At the close of Friday’s formal trading session, WTI lost $1.00 to settle at $78.26. At the close of Monday’s formal trading session, WTI added 86 cents to close at $79.12. Today crude is trading around $78 compared to $78 a week ago. Crude prices are about $8 more than a year ago.
Drivers can find current gas prices along their route with the free AAA Mobile app for iPhone, iPad and Android. The app can also be used to map a route, find discounts, book a hotel and access AAA roadside assistance. Learn more at AAA.com/mobile.
Diesel
For the week, the national average decreases four cents to $3.94 a gallon. The record high is $5.816 set on June 19, 2022. The Oregon average loses two cents to $4.23. The record high is $6.47 set on July 3, 2022. A year ago the national average for diesel was $4.02 and the Oregon average was $4.49.
Find current fuel prices at GasPrices.AAA.com.
AAA news releases, high resolution images, broadcast-quality video, fact sheets and podcasts are available on the AAA NewsRoom at NewsRoom.AAA.com.
Find local news releases at https://oregon.aaa.com/community/media/media-contacts.html
Fuel prices are updated daily at AAA’s Daily Fuel Gauge at AAA Gas Prices. For more info go www.AAA.com. AAA Oregon/Idaho provides more than 890,000 members with travel, insurance, financial and automotive-related services, and is an affiliate of AAA National, serving more than 64 million motorists in North America.