Oregon average edges lower but national average climbs
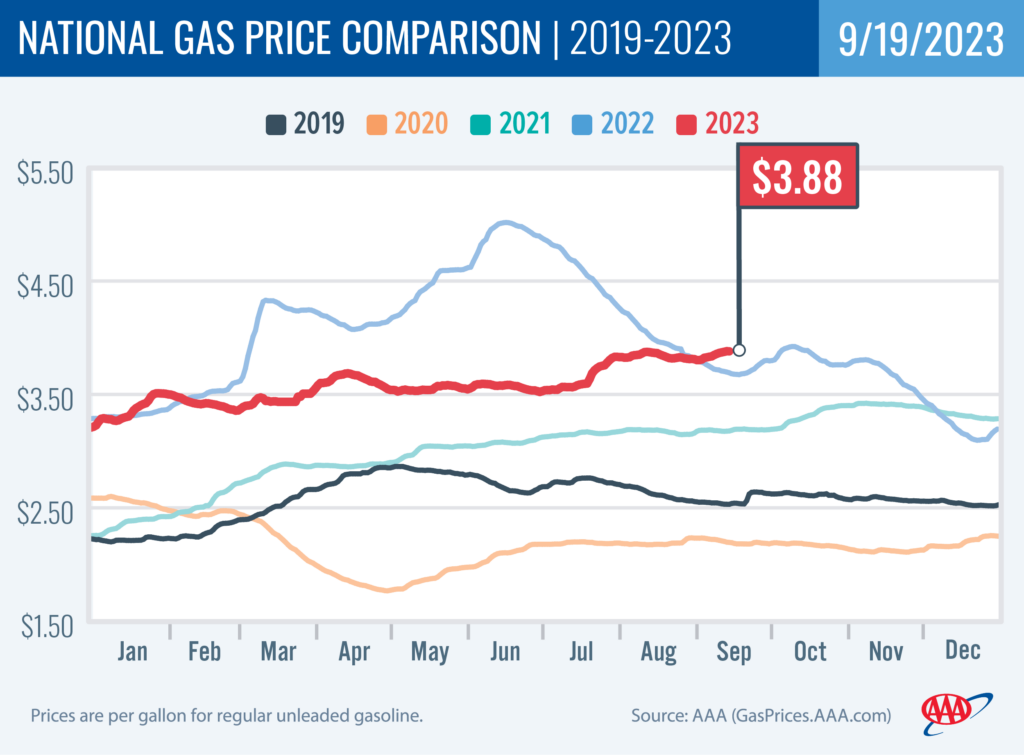
PORTLAND, Ore., – Crude oil prices have surged above $90 per barrel, the highest price since last November. The higher cost of oil and refinery issues have sent pump prices higher in most states, while other states, including Oregon, have seen prices fall. For the week, the national average climbs four cents to $3.88. The Oregon average slips two cents to $4.69.
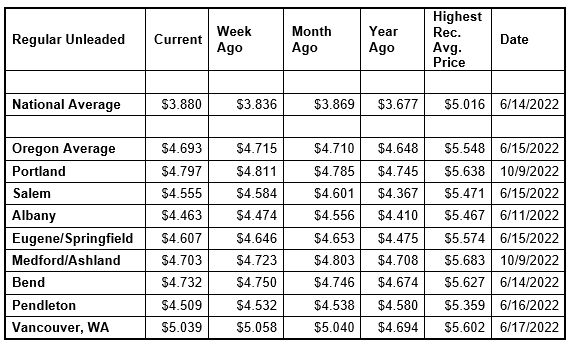
The national average reached its highest price of the year yesterday (Monday, September 18) at $3.881. The year-to-date high for the Oregon average is $4.771 on August 30.
The switch to winter-blend fuel occurred on September 15 in all states except California which waits until October 31. Winter-blend gas is cheaper to produce than summer-blend fuel, so gas prices normally decline when the switch occurs. Summer-blend gas helps reduce emissions from gasoline during the warm summer months. More info on summer- and winter-blend gasoline can be found at the EPA website.
Refinery maintenance often occurs during the spring and fall switches to summer-blend and winter-blend gas. This can cause temporary gasoline supply glitches which can send pump prices higher
“The national average has been steadily climbing since late August. Refinery issues caused prices to spike in several states, sending the national average higher. The Oregon average has been mostly declining since late August,” says Marie Dodds, public affairs director for AAA Oregon/Idaho.
Some refineries in California have had issues, causing gas prices to spike in California and other western states. Last week’s storm Lee was in the path of a refinery in St. John, New Brunsick that produces 300,000 barrels a day. This sent prices higher in many East Coast states. It’s reported that there was no serious damage to the refinery.
Crude oil prices have surged above $90 per barrel, the highest price since last November, in response to the announcement from Saudi Arabia and Russia that they would keep their production cuts in place through 2023. The cuts are one million barrels a day by Saudi Arabia and 300,000 barrels a day by Russia.
Crude oil is trading around $91 today compared to $89 a week ago and $86 a year ago. In August, West Texas Intermediate ranged between about $77 and $85 per barrel. In July, West Texas Intermediate ranged between about $69 and $82 per barrel. In June, WTI ranged between about $67 and $73 per barrel. In May, WTI ranged between about $63 and $77 per barrel. In April, WTI ranged between about $73 and $83. In March, WTI ranged between about $64 and $81 per barrel. In February, WTI ranged between about $73 and $80 per barrel. In January, WTI ranged between about $73 and $82 bbl. Crude reached recent highs of $123.70 on March 8, 2022, shortly after the Russian invasion of Ukraine, and $122.11 per barrel on June 8, 2022. The all-time high for WTI crude oil is $147.27 in July 2008.
Crude oil is the main ingredient in gasoline and diesel, so pump prices are impacted by crude prices on the global markets. On average, about 50% of what we pay for in a gallon of gasoline is for the price of crude oil, 25% is refining, 11% distribution and marketing, and 14% are taxes, according to the U.S. Energy Information Administration.
Demand for gasoline tumbled from 9.32 million b/d to 8.31 million b/d for the week ending September 8, according to the U.S. Energy Information Administration (EIA). This compares to 8.49 million b/d a year ago. Meanwhile, total domestic gasoline stocks jumped from 214.7 to 220.3 million bbl. Although gas demand has dropped amid increasing stocks, elevated oil prices have pushed pump prices higher.
Quick stats
Oregon is one of 15 states with lower prices now than a week ago. Nevada (+34 cents), California (+30 cents) and Arizona (+21 cents) have the largest weekly jumps and are in the parts of the West that were impacted by refinery issues. Georgia (-20 cents) has the biggest weekly decrease.
California ($5.76) has the most expensive gas in the nation for the eighth week in a row. Washington ($5.05) is second, and Nevada ($5.02) is third. These are the three states with averages at or above $5 a gallon. Hawaii ($4.82) is fourth, Oregon ($4.69) is fifth, Alaska ($4.62) is sixth, Arizona ($4.61) is seventh, Utah ($4.29) is eighth, Montana ($4.20) is ninth, Idaho ($4.15) is 10th, and Colorado ($4.01) is 11th. These are the 11 states with averages at or above $4 a gallon, down from 12 states a week ago. This week 39 states and the District of Columbia have averages in the $3-range. No state has an average in the $2 range this week.
The cheapest gas in the nation is in Mississippi ($3.30) and Georgia ($3.37). For the 140th week in a row, no state has an average below $2 a gallon.
The difference between the most expensive and least expensive states is $2.46 this week, compared to $2.20 a week ago.
Oregon is one of 21 states and the District of Columbia with lower prices now than a month ago. The national average is one cent more and the Oregon average is two cents less than a month ago. Nevada (+57 cents), California (+53 cents) and Arizona (+38 cents) have the largest monthly jumps. Indiana (-27 cents) has the largest monthly drop. The average in Wyoming is flat.
Oregon is one of 43 states and the District of Columbia with higher prices now than a year ago. The national average is 20 cents more and the Oregon average is five cents more than a year ago. This is the fourth-smallest yearly increase in the nation. Arizona (+57 cents) has the largest yearly increase. Hawaii (-46 cents) has the largest year-over-year drop.
West Coast
The West Coast region continues to have the most expensive pump prices in the nation with all seven states in the top 10. It’s typical for the West Coast to have six or seven states in the top 10 as this region tends to consistently have fairly tight supplies, consuming about as much gasoline as is produced. In addition, this region is located relatively far from parts of the country where oil drilling, production and refining occurs, so transportation costs are higher. And environmental programs in this region add to the cost of production, storage and distribution.
| Rank | Region | Price on 9/19/23 |
| 1 | California | $5.76 |
| 2 | Washington | $5.05 |
| 3 | Nevada | $5.02 |
| 4 | Hawaii | $4.82 |
| 5 | Oregon | $4.69 |
| 6 | Alaska | $4.62 |
| 7 | Arizona | $4.61 |
| 8 | Utah | $4.29 |
| 9 | Montana | $4.20 |
| 10 | Idaho | $4.15 |
As mentioned above, California has the most expensive gas in the country. Washington, Nevada, Hawaii, Oregon, Alaska, and Arizona round out the top seven. Oregon slips to fifth after 14 weeks at fourth.
Three states in the region are seeing the largest weekly jumps in the country: Nevada (+33 cents), California (+30 cents), and Arizona (+21 cents). Hawaii (+2 cents), Alaska (+2 cents) also have week-over-week increases. Oregon (-2 cents) and Washington (-2 cents) are the only states in the region with week-over-week declines.
The refinery utilization rate on the West Coast rose from 90.2% to 92.0% for the week ending September 8. This rate has ranged between about 73% to 96% in the last year. The latest national refinery utilization rate increased from 93.1% to 93.7%.
According to EIA’s latest weekly report, total gas stocks in the region increased from 26.30 million bbl. to 28.19 million bbl.
A higher refinery utilization rate and an increase in gasoline stocks can put downward pressure on pump prices. However, the rally in crude oil prices is putting upward pressure on pump prices.
Oil market dynamics
Crude oil prices rallied last week on ongoing market concern that global oil supply will remain tight for the rest of the year, due to the extension of cuts made by Saudi Arabia and Russia. According to the International Energy Agency’s September 2023 Oil Market Report, these production cuts will lead to an oil supply shortfall this fall and winter. Meanwhile, the EIA reported that total domestic commercial crude inventories increased by 4 million bbl to 420.6 million bbl.
At the close of Friday’s formal trading session, WTI slipped 61 cents to settle at $90.77. At the close of Monday’s formal trading session, WTI added 71 cents to settle at $91.48. Today crude is trading around $91 compared to $89 a week ago. Crude prices are about $6 more than a year ago.
Drivers can find current gas prices along their route with the free AAA Mobile app for iPhone, iPad and Android. The app can also be used to map a route, find discounts, book a hotel and access AAA roadside assistance. Learn more at AAA.com/mobile.
Diesel
For the week, the national average rises nine cents to $4.58 a gallon. The record high is $5.816 set on June 19, 2022. The Oregon average adds four cents to $5.24. The record high is $6.47 set on July 3, 2022. A year ago the national average for diesel was $4.95 and the Oregon average was $5.49.
Find current fuel prices at GasPrices.AAA.com.
AAA news releases, high resolution images, broadcast-quality video, fact sheets and podcasts are available on the AAA NewsRoom at NewsRoom.AAA.com.
Find local news releases at https://oregon.aaa.com/community/media/media-contacts.html
Fuel prices are updated daily at AAA’s Daily Fuel Gauge at AAA Gas Prices. For more info go www.AAA.com. AAA Oregon/Idaho provides more than 890,000 members with travel, insurance, financial and automotive-related services, and is an affiliate of AAA National, serving more than 63 million motorists in North America.