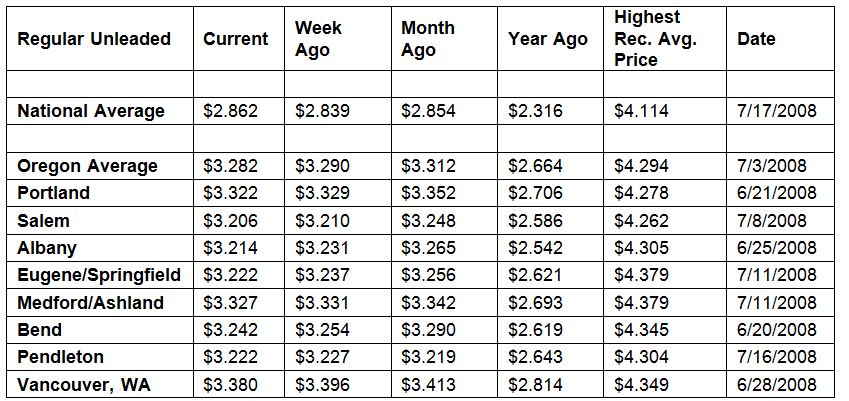
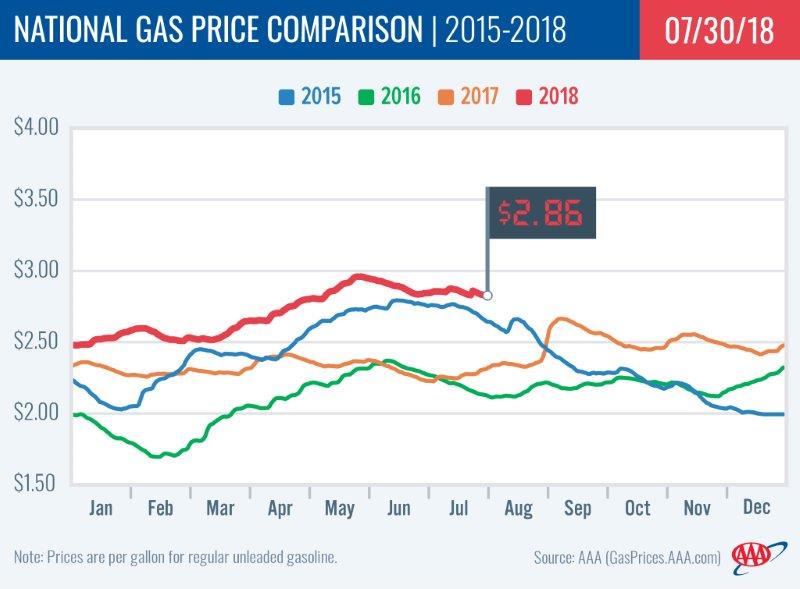
PORTLAND, Ore., – Retail gas prices are trending higher in most states this week due to stronger demand and declining supplies. However on the West Coast, prices are ticking down in every state as supplies in this region grew. For the week, the national average adds two cents to $2.86 a gallon. The Oregon average loses a penny to $3.28.
Crude oil and gasoline inventories have tightened in the U.S. According to the latest U.S. Energy Information Administration (EIA) report, total crude inventories fell on the week and now register at 405 million bbl, which is 80 million bbl lower than levels at the same time last year. On the week, pump prices jumped as much as 11 cents in some states, while other states saw decreases of up to two cents.
“If crude and gas inventories continue to tighten, drivers can expect pump prices to move higher and remain volatile,” says Marie Dodds, public affairs director for AAA Oregon/Idaho.
Oregon is one of 14 states where prices are lower now than a week ago. The largest decreases are in Delaware (-2 cents) and Utah (-2 cents). 36 states report weekly increases with the largest jumps in Michigan (+11 cents) and Ohio (+8 cents). The average in Maryland is flat. This week 12 states have averages at or above $3 a gallon, same as a week ago.
Oregon is one of 24 states where prices are lower than one month ago. The national average is one cent more and the Oregon average is three cents less than a month ago. Oregon has the 10th-largest monthly decrease in the country. New Mexico (-13 cents) has the largest monthly decrease, while Delaware (+8 cents) has the largest monthly increase.
The West Coast continues to have the most expensive gas prices in the nation. Hawaii tops the list for the eighth week in a row with California, Washington, Alaska, Oregon and Nevada rounding out the top six. Oregon is fifth for the sixth consecutive week. Prices in all West Coast states are down this week, except Alaska where the average is up half a cent.
| Rank | Region | Price on 7/31/18 | |
| 1 | Hawaii | $3.78 | |
| 2 | California | $3.62 | |
| 3 | Washington | $3.40 | |
| 4 | Alaska | $3.38 | |
| 5 | Oregon | $3.28 | |
| 6 | Nevada | $3.20 | |
| 7 | Idaho | $3.11 | |
| 8 | Utah | $3.08 | |
| 9 | Connecticut | $3.07 | |
| 10 | District of Columbia | $3.06 |
According to EIA’s petroleum status report for the week ending on July 20, inventories of gasoline in the region grew by 300,000 bbl. They now sit at 30.6 million bbl, which is nearly 3.5 million bbl higher than total levels at this time last year. The surplus will likely help guard against price spikes in the event that supply tightens in the region this week.
The nation’s cheapest markets are Alabama ($2.56) and Mississippi ($2.56). For the 52nd week in a row, no states have an average below $2.
Drivers in all 50 states and the District of Columbia are paying more than a year ago to fill up. The national average is 55 cents more and the Oregon average is 62 cents more than a year ago. This is the sixth-largest yearly increase in the country. Hawaii (+73 cents) has the greatest year-over-year increase; Arizona (+70 cents) is second; California (+69 cents) is third and Wyoming (+65 cents) is fourth.
Oil Market Dynamics
Crude oil prices continue to be volatile. Oil prices trended higher last week with the release of EIA’s weekly report that total crude inventories fell by 6.2 million bbl and face a year-over-year deficit of 80 million bbl. The tightened domestic crude supply amid robust global gasoline demand and high global crude demand will likely sustain into the near future the more expensive crude oil prices, which are $20/bbl more compared to last year.
Additionally, the market will look at EIA’s supply data and July crude production data from OPEC and its partners — both of which will be released later this week — to determine how supply and demand are faring since the cartel announced that it would increase production to ease global crude price growth. Moreover, according to Baker Hughes, Inc., the U.S. added three oil rigs last week, bringing the total to 861. Currently, there are 95 more active rigs this year than last year at this time.
At the close of Friday’s formal trading session on the NYMEX, WTI decreased 92 cents to settle at $68.69. At the close of Monday’s formal trading session on the NYMEX, WTI gained $1.44 to settle at $70.13. Today crude is trading around $69, same as a week ago. Crude prices are down about seven percent in the last month and are about $20 more per barrel than a year ago.
Drivers can find current gas prices along their route with the free AAA Mobile app for iPhone, iPad and Android. The app can also be used to map a route, find discounts, book a hotel and access AAA roadside assistance. Learn more at AAA.com/mobile.
Diesel
For the week, the national average remains at $3.15 a gallon. Oregon’s average slips a penny to $3.40. A year ago the national average for diesel was $2.47 and the Oregon average was $2.66.
Find current fuel prices at GasPrices.AAA.com.
AAA news releases, high resolution images, broadcast-quality video, fact sheets and podcasts are available on the AAA NewsRoom at NewsRoom.AAA.com.