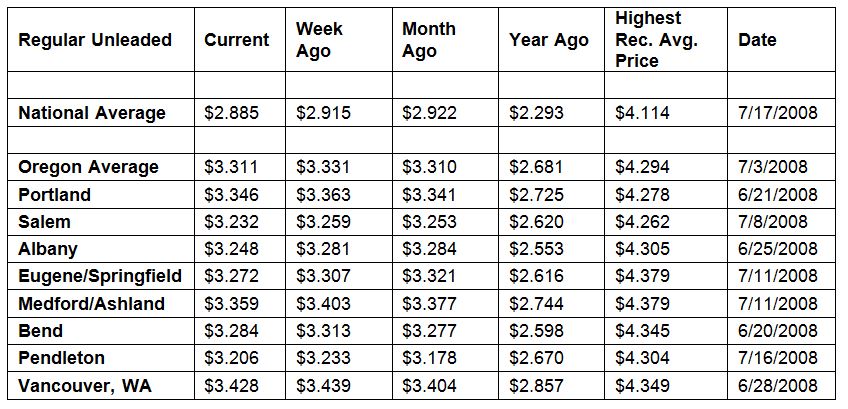
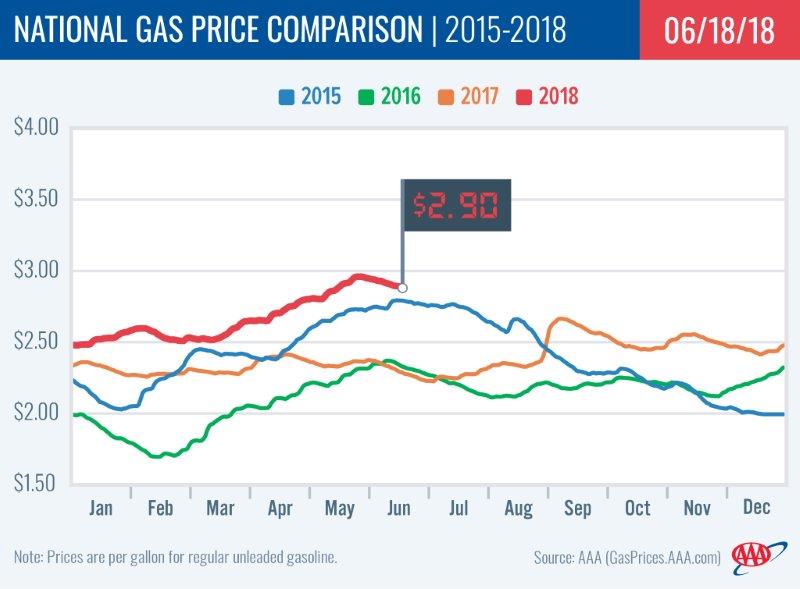
PORTLAND, Ore., – Gas prices are steady or edging lower in most states but that trend may reverse soon due to spiking demand. For the week, the national average for regular slides three cents to $2.89 a gallon. The Oregon average dips two cents to $3.31.
The latest report from the U.S. Energy Information Administration (EIA) shows a new all-time record for gasoline demand at 9.88 million b/d for the week ending June 8. U.S. gasoline inventories plummeted 2.27 million bbl, to land total inventories at 237 million bbl, which is 5.7 million below stocks last year at this time.
“If demand continues to grow and inventories decrease in the weeks ahead, gas prices will likely climb again,” says Marie Dodds, public affairs director for AAA Oregon/Idaho. “AAA expects the national gas price average to range between $2.85 and $3.05 through Labor Day, likely seeing the summer’s highest prices in June. The Oregon average will likely be around $3.25 to $3.50 a gallon this summer, barring unforeseen events.”
Another factor that will influence gas prices in the near and long-term will be outcomes from the June 22 OPEC meeting in Vienna, Austria. The cartel, along with other major producers including Russia, will discuss increasing oil production ahead of the year-end scheduled dissolution of its production reduction agreement. Some reports indicate that OPEC could be looking at an increase of 300,000 to 600,000 b/d to help ease global crude price gains that have grown since the cartel put its production reduction agreement into place at the beginning of 2017. An increase in production would likely decrease crude oil prices and encourage cheaper gas prices.
Oregon is one of 43 states and the District of Columbia reporting week-over-week decreases. The largest decreases are in Ohio (-10 cents) and Delaware (-5 cents). Only seven states report weekly increases. Indiana has the largest (+3 cents). This week 14 states have averages at or above $3 a gallon, same as last week.
Oregon is one of 18 states where prices are higher than one month ago. The national average is three cents more and the Oregon average is fractions of a cent higher than a month ago. Oregon has the 49th-largest monthly increase in the country. Wyoming (+12 cents) has the largest monthly increase, while Ohio (-20 cents) has the largest monthly decrease.
The West Coast continues to have the most expensive gas prices in the nation. Hawaii is most expensive for the second week in a row with California, Washington, Alaska, Nevada and Oregon rounding out the top six. Oregon falls to sixth after three weeks at fifth.
| Rank | Region | Price on 6/19/18 | |
| 1 | Hawaii | $3.73 | |
| 2 | California | $3.70 | |
| 3 | Washington | $3.45 | |
| 4 | Alaska | $3.43 | |
| 5 | Nevada | $3.31 | |
| 6 | Oregon | $3.31 | |
| 7 | Utah | $3.19 | |
| 8 | Idaho | $3.19 | |
| 9 | Connecticut | $3.11 | |
| 10 | Arizona | $3.07 |
On the week, prices continue to mostly decline in the region by a penny or two. However, Hawaii and Alaska each increased by fractions of a cent.
According to EIA data for the week ending on June 8, inventories of gasoline on the West Coast grew by 400,000 bbl to reach 31.5 million bbl. Although inventories in the region now sit at their highest level for the second week of June since 2001, ongoing planned maintenance at Shell’s 158,000 b/d Martinez, CA refinery in the Bay area may restrict supplies this week.
The nation’s cheapest markets are South Carolina ($2.54) and Mississippi ($2.57). For the 46th week in a row, no states have an average below $2.
Drivers in all 50 states and the District of Columbia are paying are paying more than a year ago to fill up. The national average is 59 cents more and the Oregon average is 63 cents more than a year ago. This is the 10th-largest yearly increase in the country. Arizona has the greatest year-over-year increase of 78 cents; Indiana is second at 78 cents; and New Mexico is third at 70 cents, and California is fourth at 69 cents.
Oil Market Dynamics
Oil prices will likely continue their roller coaster ride this week ahead of the OPEC meeting on Friday. Four weeks ago, crude oil prices were at three-and-a-half year highs of about $73 per barrel. Then crude prices tumbled in late May after reports that OPEC might ease its production cuts. Since then, prices have remained below $70. Oil prices trended marginally higher last week because of a stronger dollar.
According to EIA’s latest weekly petroleum status report, total U.S. production jumped to around 10.9 million b/d, up about 100,000 b/d on the week. However, total crude inventories fell by 4.1 million bbl. Increasing crude exports supported the drop. Last week, exports of crude oil stood at 2.03 million b/d, a week-on-week gain of 316,000 b/d.
Domestic investment in crude production continues to grow. Last week, the U.S. added another oil rig, bringing the current total to 863. When compared to last year’s rig count at this time, there are 116 more active rigs today.
At the close of Friday’s formal trading session on the NYMEX, WTI decreased $1.83 cents to settle at $65.06. At the close of Monday’s formal trading session on the NYMEX, WTI added 79 cents to settle at $65.85. Today crude is trading around $65, compared to $67 a week ago. Crude prices are down about 11 percent in the last month and are about $21 more per barrel than a year ago.
Drivers can find current gas prices along their route with the free AAA Mobile app for iPhone, iPad and Android. The app can also be used to map a route, find discounts, book a hotel and access AAA roadside assistance. Learn more at AAA.com/mobile.
Diesel
For the week, the national average slips two cents to $3.18 a gallon. Oregon’s average loses a penny to $3.42. A year ago the national average for diesel was $2.47 and the Oregon average was $2.67.
Find current fuel prices at GasPrices.AAA.com.
AAA news releases, high resolution images, broadcast-quality video, fact sheets and podcasts are available on the AAA NewsRoom at NewsRoom.AAA.com.