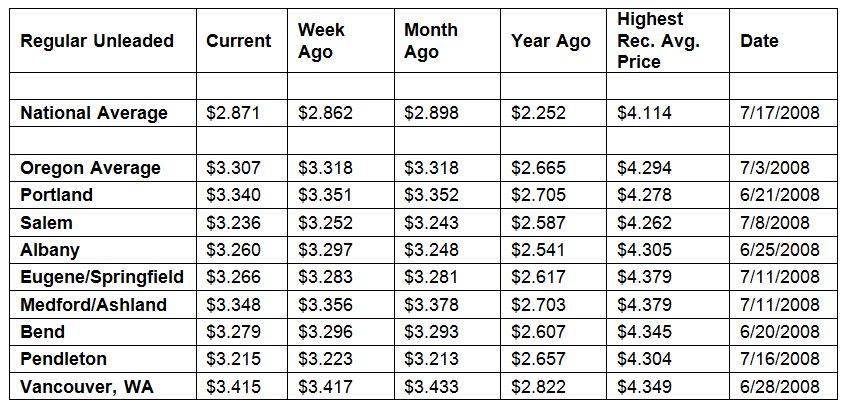
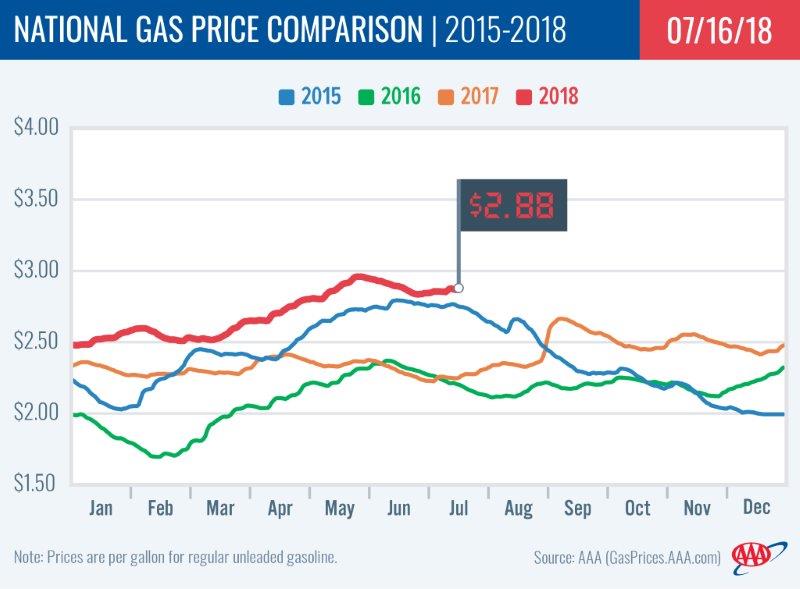
PORTLAND, Ore., – Pump prices are fairly steady this week with slight increases or decreases in most states. For the week, the national average for regular adds a penny to $2.87 a gallon. The Oregon average slips a penny to $3.31.
“During July, pump prices usually move a bit lower. This year, however, crude oil prices are about $22 more per barrel than last year. If this trend continues, and we see any supply disruptions such as a hurricane, pump prices could climb in a hurry.”
Oregon is one of 24 states reporting week-over-week decreases. The largest are in Arizona (-3 cents) and New Mexico (-2 cents). The largest weekly increases are in Florida (+7 cents) and Michigan (+7 cents). This week 12 states have averages at or above $3 a gallon, down from 13 a week ago.
Oregon is one of 39 states where prices are lower than one month ago. The national average is two cents less and the Oregon average is one cent less than a month ago. Oregon has the 47th-largest monthly decrease in the country. New Mexico (-12 cents) has the largest monthly decrease, while Ohio (+10 cents) has the largest monthly increase.
The West Coast continues to have the most expensive gas prices in the nation. Hawaii tops the list for the sixth week in a row with California, Washington, Alaska, Oregon and Nevada rounding out the top six. Oregon is fifth for the fourth consecutive week.
| Rank | Region | Price on 7/17/18 | |
| 1 | Hawaii | $3.78 | |
| 2 | California | $3.65 | |
| 3 | Washington | $3.43 | |
| 4 | Alaska | $3.40 | |
| 5 | Oregon | $3.31 | |
| 6 | Nevada | $3.22 | |
| 7 | Idaho | $3.13 | |
| 8 | Utah | $3.12 | |
| 9 | Connecticut | $3.08 | |
| 10 | Pennsylvania | $3.05 |
Prices in most West Coast states are down week-over-week with declines of one to three cents. Only Hawaii (+3 cents) saw an increase.
According to the U.S. Energy Information Administration’s (EIA) petroleum status report for the week ending on July 6, inventories of gasoline in the West Coast region grew by 300,000 bbl. They now sit at 30.8 million bbl, which is just over 2 million bbl higher than total levels at this time last year. The surplus will likely help guard against price spikes in the event that supply tightens in the region this week.
The nation’s cheapest markets are Alabama ($2.55) and Mississippi ($2.56). For the 50th week in a row, no states have an average below $2.
Drivers in all 50 states and the District of Columbia are paying more than a year ago to fill up. The national average is 62 cents more and the Oregon average is 64 cents more than a year ago. This is the 12th-largest yearly increase in the country. California (+74 cents) has the greatest year-over-year increase; Hawaii (+73 cents) is second; Arizona (+73 cents) is third and Wyoming (+72 cents) is fourth.
Oil Market Dynamics
It’s been a roller coaster ride for oil prices this summer. West Texas Intermediate climbed above $74 per barrel in late June for the first time since late 2014. This week, WTI is back below $70 per barrel. Oil prices dropped to start this week after news that the Trump administration is considering a release from the U.S. Strategic Petroleum Exchange.
Crude prices climbed last week amid concerns surrounding tightening U.S. supplies following EIA’s news that total crude oil stocks recorded the largest decline (12.7 million bbl) since October 2016. Oil prices may continue riding high and contribute to increased pump prices throughout the summer and possibly into the fall, especially if demand remains robust amid high export levels.
The U.S. oil rig count remains unchanged from the previous week, according to Baker Hughes, Inc., keeping the total number of rigs to 863. When compared to last year’s count at this time, there are 98 more rigs.
At the close of Friday’s formal trading session on the NYMEX, WTI increased 68 cents to settle at $71.01. At the close of Monday’s formal trading session on the NYMEX, WTI lost $2.95 to settle at $68.06. Today crude is trading around $67, compared to $74 a week ago. Crude prices are up about three percent in the last month and are about $22 more per barrel than a year ago.
Drivers can find current gas prices along their route with the free AAA Mobile app for iPhone, iPad and Android. The app can also be used to map a route, find discounts, book a hotel and access AAA roadside assistance. Learn more at AAA.com/mobile.
Diesel
For the week, the national average is flat at $3.17 a gallon. Oregon’s average holds steady at $3.42. A year ago the national average for diesel was $2.44 and the Oregon average was $2.65.
Find current fuel prices at GasPrices.AAA.com.
AAA news releases, high resolution images, broadcast-quality video, fact sheets and podcasts are available on the AAA NewsRoom at NewsRoom.AAA.com.